Knowledge graphs in Gartner’s hype cycle. The Year of the Graph Newsletter Vol. 5, September 2018

Knowledge graphs in Gartner’s hype cycle, machine learning extensions and visual tools for graph databases, Ethereum analytics with RDF, Using Gremlin with R, SPARQL, and Spring, graph database research wins best paper award in VLDB, and benchmarking AWS Neptune.
Not bad for a typical summer vacation month such as August. This edition of the Year of the Graph newsletter had to be extended to make sure we include as much of the good stuff as possible.
Gartner’s hype cycle for 2018 was recently released, and knowledge graphs were included for the first time. If you wanted official proof it is the year of the graph, there you have it. When a hitherto niche technology gets in the spotlight, some explanations are in order, and Andreas Blumauer from the Semantic Web Company has a go at this.

Knowledge Graphs – Connecting the Dots in an Increasingly Complex World
Bye Bye Silos! Those who stay on their islands will fall back. This statement is valid on nearly any level of our increasingly complex society
Google has had a knowledge graph for a while now. But developing and using a knowledege graph at web scale is no easy feat. Diffbot claim to have managed to do just that, turning the web into the world’s largest knowledge graph.

The web as a database: The biggest knowledge graph ever
Imagine you could get the entire web in a database, and structure it. Then you would be able to get answers to complex questions in seconds by querying, rather than searching. This is what Diffbot promises.
There is a lot to be said about knowledge graphs, what they are, and how to build them. A graph database will be the foundation on which you build one, but that’s not the only thing you can use graph databases for. Neo4j’s Jennifer Reif talks about when graph databases make sense.

How Do You Know If a Graph Database Solves the Problem?
One of the greatest questions to consistently badger a developer is “what technology should I use?”. The analysis from days of thought and input determines which option best suits the need, manages volume and demand, plans for long-term strategy, simplifies/reduces support, and gets approved by colleagues and management.
Here’s the thing about knowledge graphs: you don’t necessarily need to move all your data to a graph database in order to build one. But you do need to have the right pointers and metadata about your data, and for this you do need a graph database. Kurt Cagle from Semantical LLC describes the approach.

Building Semantic Data Catalogs
We have a huge amount of siloed data, and would prefer to not have to move or duplicate that data but still need to get at it.
Since we’re at the semantic side of things in graphs, check out how Alethio and SANSA combined the SANSA stack for reading and querying large scale RDF data with two of the most classic graph algorithms, Connected Components and PageRank, to do analytics on the Ethereum network.

The Hubs & Authorities in Transaction Network — Powered by SANSA and Graph Analysis
Alethio’s data scientists dig into the Ethereum blockchain to identify the major players across the transaction network. Leveraging the rich data available through Alethio’s platform, learn about the Hubs and Authorities of the Ethereum blockchain through Alethio’s most recent case study.
RDF and graph analytics, check. RDF and machine learning, check too. Expect to see this more and more going forward. Here Pedro Oliveira from Stardog outlines how Stardog’s machine learning extensions for SPARQL do similarity search.
Neo4j also has some machine learning extensions. Lauren Shin, an intern at Neo4j, has developed some extensions for linear regression, which she outlines here.

Graphs and ML: Multiple Linear Regression
Last time, I used simple linear regression from the Neo4j browser to create a model for short-term rentals in Austin, TX. In this post, I demonstrate how, with a few small tweaks, the same set of user-defined procedures can create a linear regression model with multiple independent variables.
Another contributor, Peter Heisig from Technische Universität Dresden, another Neo4j extension. Heisig has built a Graph View Editor to interact with Neo4j, skipping the writing Cypher part.

Neo4j Graph View Editor
The Neo4j1 Browser2 is a great tool for querying a graph and comes with a well designed user interface that supports data visualization and iterative exploration. But in terms of manipulation, the user has to write Cypher3-queries, respectively knowing the language in detail.
More visual tools. Dave Bechberger built an IDE for running traversals and visualizing results for Tinkerpop-enabled graph databases. It’s still early stage, but if you are not a big fan of the console, this may work well for you. And it’s open source, so you can contribute too.

Gremlin IDE
This application is a very basic development IDE for Apache Tinkerpop enabled databases built using Electron and React. With this tool you are able to perform Gremlin queries and have the data returned and displayed in one of three ways. You are able to see it as a table, the JSON, or as a node chart built on top of http://visjs.org/
But that’s not the only reason Tinkerpop users have to rejoice. Microsoft also developed and open sourced a valuable resource for Tinkerpop-enabled graph databases: a Spring Data layer for Gremlin. If you like Spring Data, you will sure appreciate this.

Spring Data Gremlin for Azure Cosmos DB Graph API
We are pleased to announce that Spring Data Gremlin is now available on Maven Central and source code on GitHub. This project provides Spring Data support for Graph databases that use Gremlin as a traversal language.
Tinkerpop on a roll: Dharmen Punjani and Harsh Thakkar from the University of Bonn just released their Gremlin – SPARQL connector, which was included in Tinkerpop. This means you can now query Tinkerpop-enabled graph databases using SPARQL.

SPARQL meets Apache Tinkerpop
Converting SPARQL queries to Gremlin path traversals has been integrated into the popular Apache Tinkerpop framework (master branch)
Wrapping up with Tinkerpop and Gremlin, Jeffrey Hanson from the University of Queensland shows how Gremlin can be used to find subgraphs in R. Hanson is a conservation scientist, drawn to graphs by problems he has to deal with in his work.
Subgraphs in R using Gremlin
Graphs are used for representing network data. They are composed of nodes and edges. Nodes represent “things” and edges represent the connections between them. But graphs can be so much more. They can be used to represent the spread of infectious diseases, predator-prey relationships in an ecosystem, or even consumer purchases in an online marketplace.
This goes to show the ubiquity of large graphs and the surprising challenges
of graph processing. That was also the title of Siddhartha Sahu’s and his co-authors’ user survey paper that won the best paper award in VLDB.

The Ubiquity of Large Graphs and Surprising Challenges of Graph Processing
Graph processing is becoming increasingly prevalent across many application domains. In spite of this prevalence, there is little research about how graphs are actually used in practice
Did you ever wonder how fast AWS Neptune really is? Not as fast as TigerGraph, according to this benchmark published by TigerGraph’s VP of Engineering Mingxi Wu. Of course, benchmarks done by vendors should always be taken with a pinch of salt, but this may give you an idea.

Amazon Neptune, the truth revealed
How does Amazon Neptune perform relative to the other graph databases? To answer this question, we conducted a benchmark on Amazon Neptune. This blog presents the discoveries revealed by our benchmark.
Performance is important of course, but choosing a graph database is a hard exercise which should take many factors into account. Good news is, somebody did this already, so you don’t have to.
The most comprehensive research on graph databases is out there, it will save you time and money, and ensure you choose what works for you. And if you’ve read this far, here’s a limited edition 33% off discount code for you: 33OFF

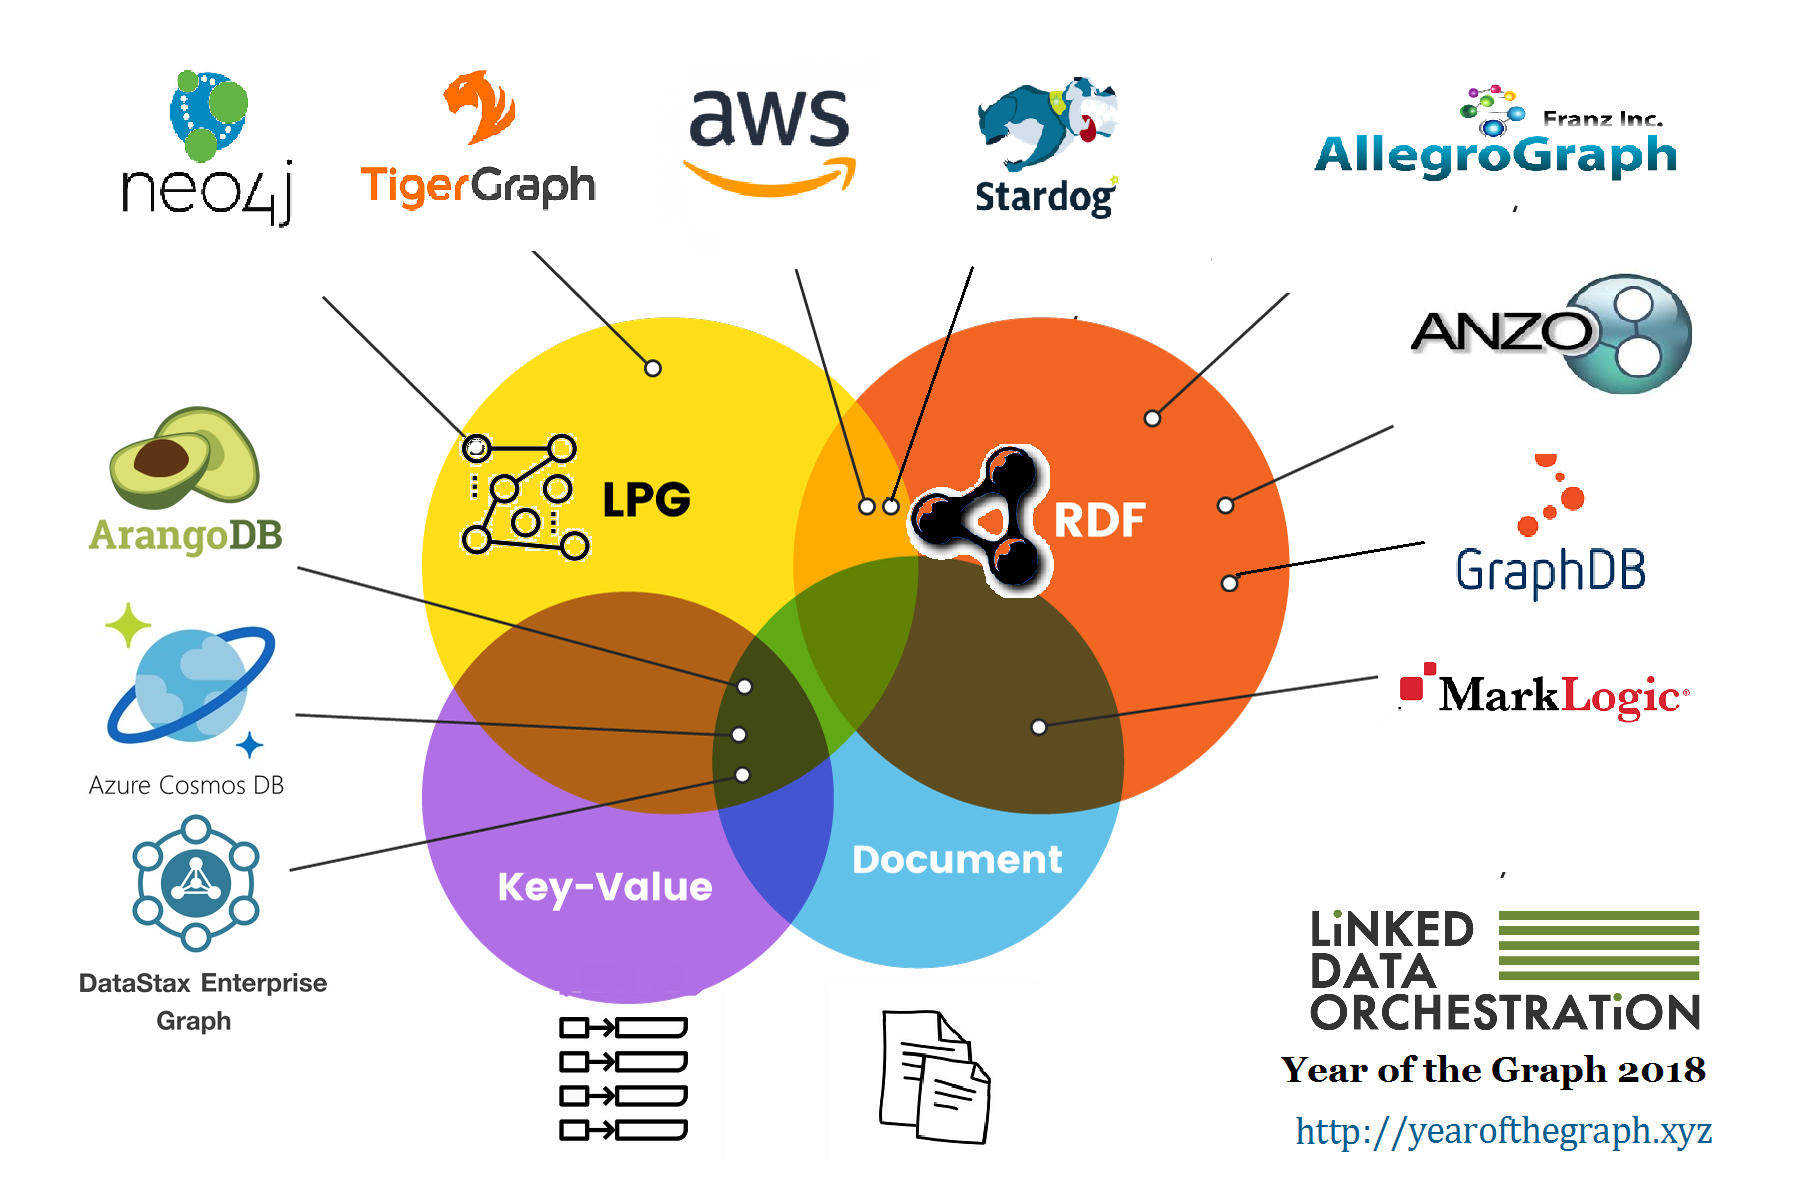
The Year of the Graph Database Report
What is a graph database? Do you really need one, and if yes, how do you choose?


