A gravitational wave moment for graph. The Year of the Graph Newsletter Vol. 11, March 2019

A gravitational wave moment for the graph community in the W3C Workshop on Web Standardization for Graph Data. Gartner includes Graph as Trend #5 in its Top 10 Data and Analytics Technology Trend for 2019. And graphs continuing to make waves in the real world in every possible way.
The graph community may have had a gravitational wave moment in March 2019 in Berlin. At the W3C Workshop on Web Standardization for Graph Data, a number of important things seem to have happenned: the property graph community taking the first steps towards standardization, the RDF community taking the first steps to resolve the long standing issue of reification, and both communities taking the first steps towards working with each other.

Graph data standardization: It’s just a graph, making gravitational waves in the real world
AWS, Google, Neo4j, Oracle. These were just some of the vendors represented in the W3C workshop on web standardization for graph data, and what transcribed is bound to boost adoption of the hottest segment in data management: Graph.
After including Knowledge Graphs in its Hype Cycle in August 2018, Gartner now includes Graph as Trend #5 in its Top 10 Data and Analytics Technology Trend for 2019: “The application of graph processing and graph DBMSs will grow at 100 percent annually through 2022 to continuously accelerate data preparation and enable more complex and adaptive data science.”
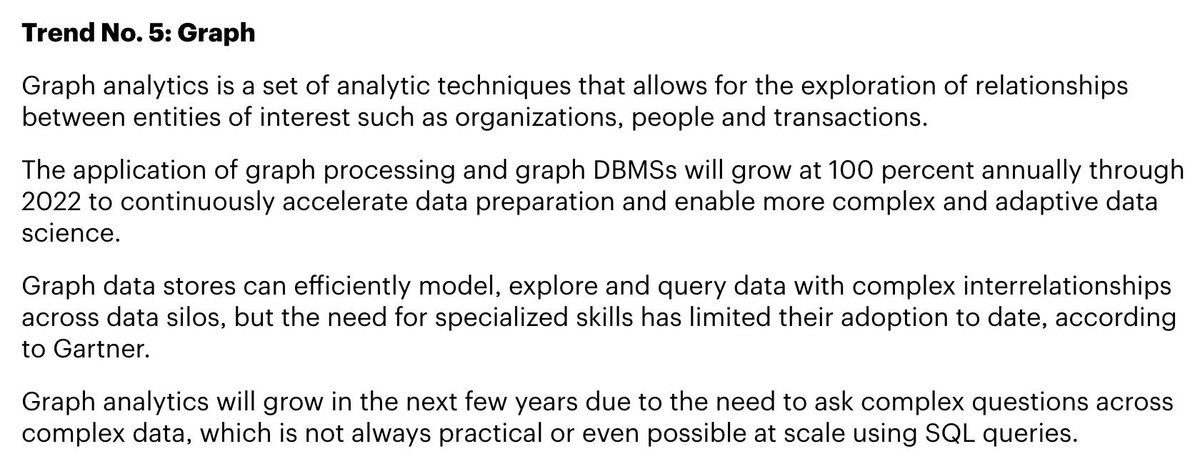
Gartner Identifies Top 10 Data and Analytics Technology Trends for 2019
Graph analytics will grow in the next few years due to the need to ask complex questions across complex data, which is not always practical or even possible at scale using SQL queries.
February saw a couple of graph landscape visuals make rounds. In chronological order, Janos Szendi-Varga from Graph Aware and Elise Devaux from Linkurious, twice, had their go at this. Note how densely populated all of these diagrams are. This speaks volumes on the proliferation of the graph ecosystem.
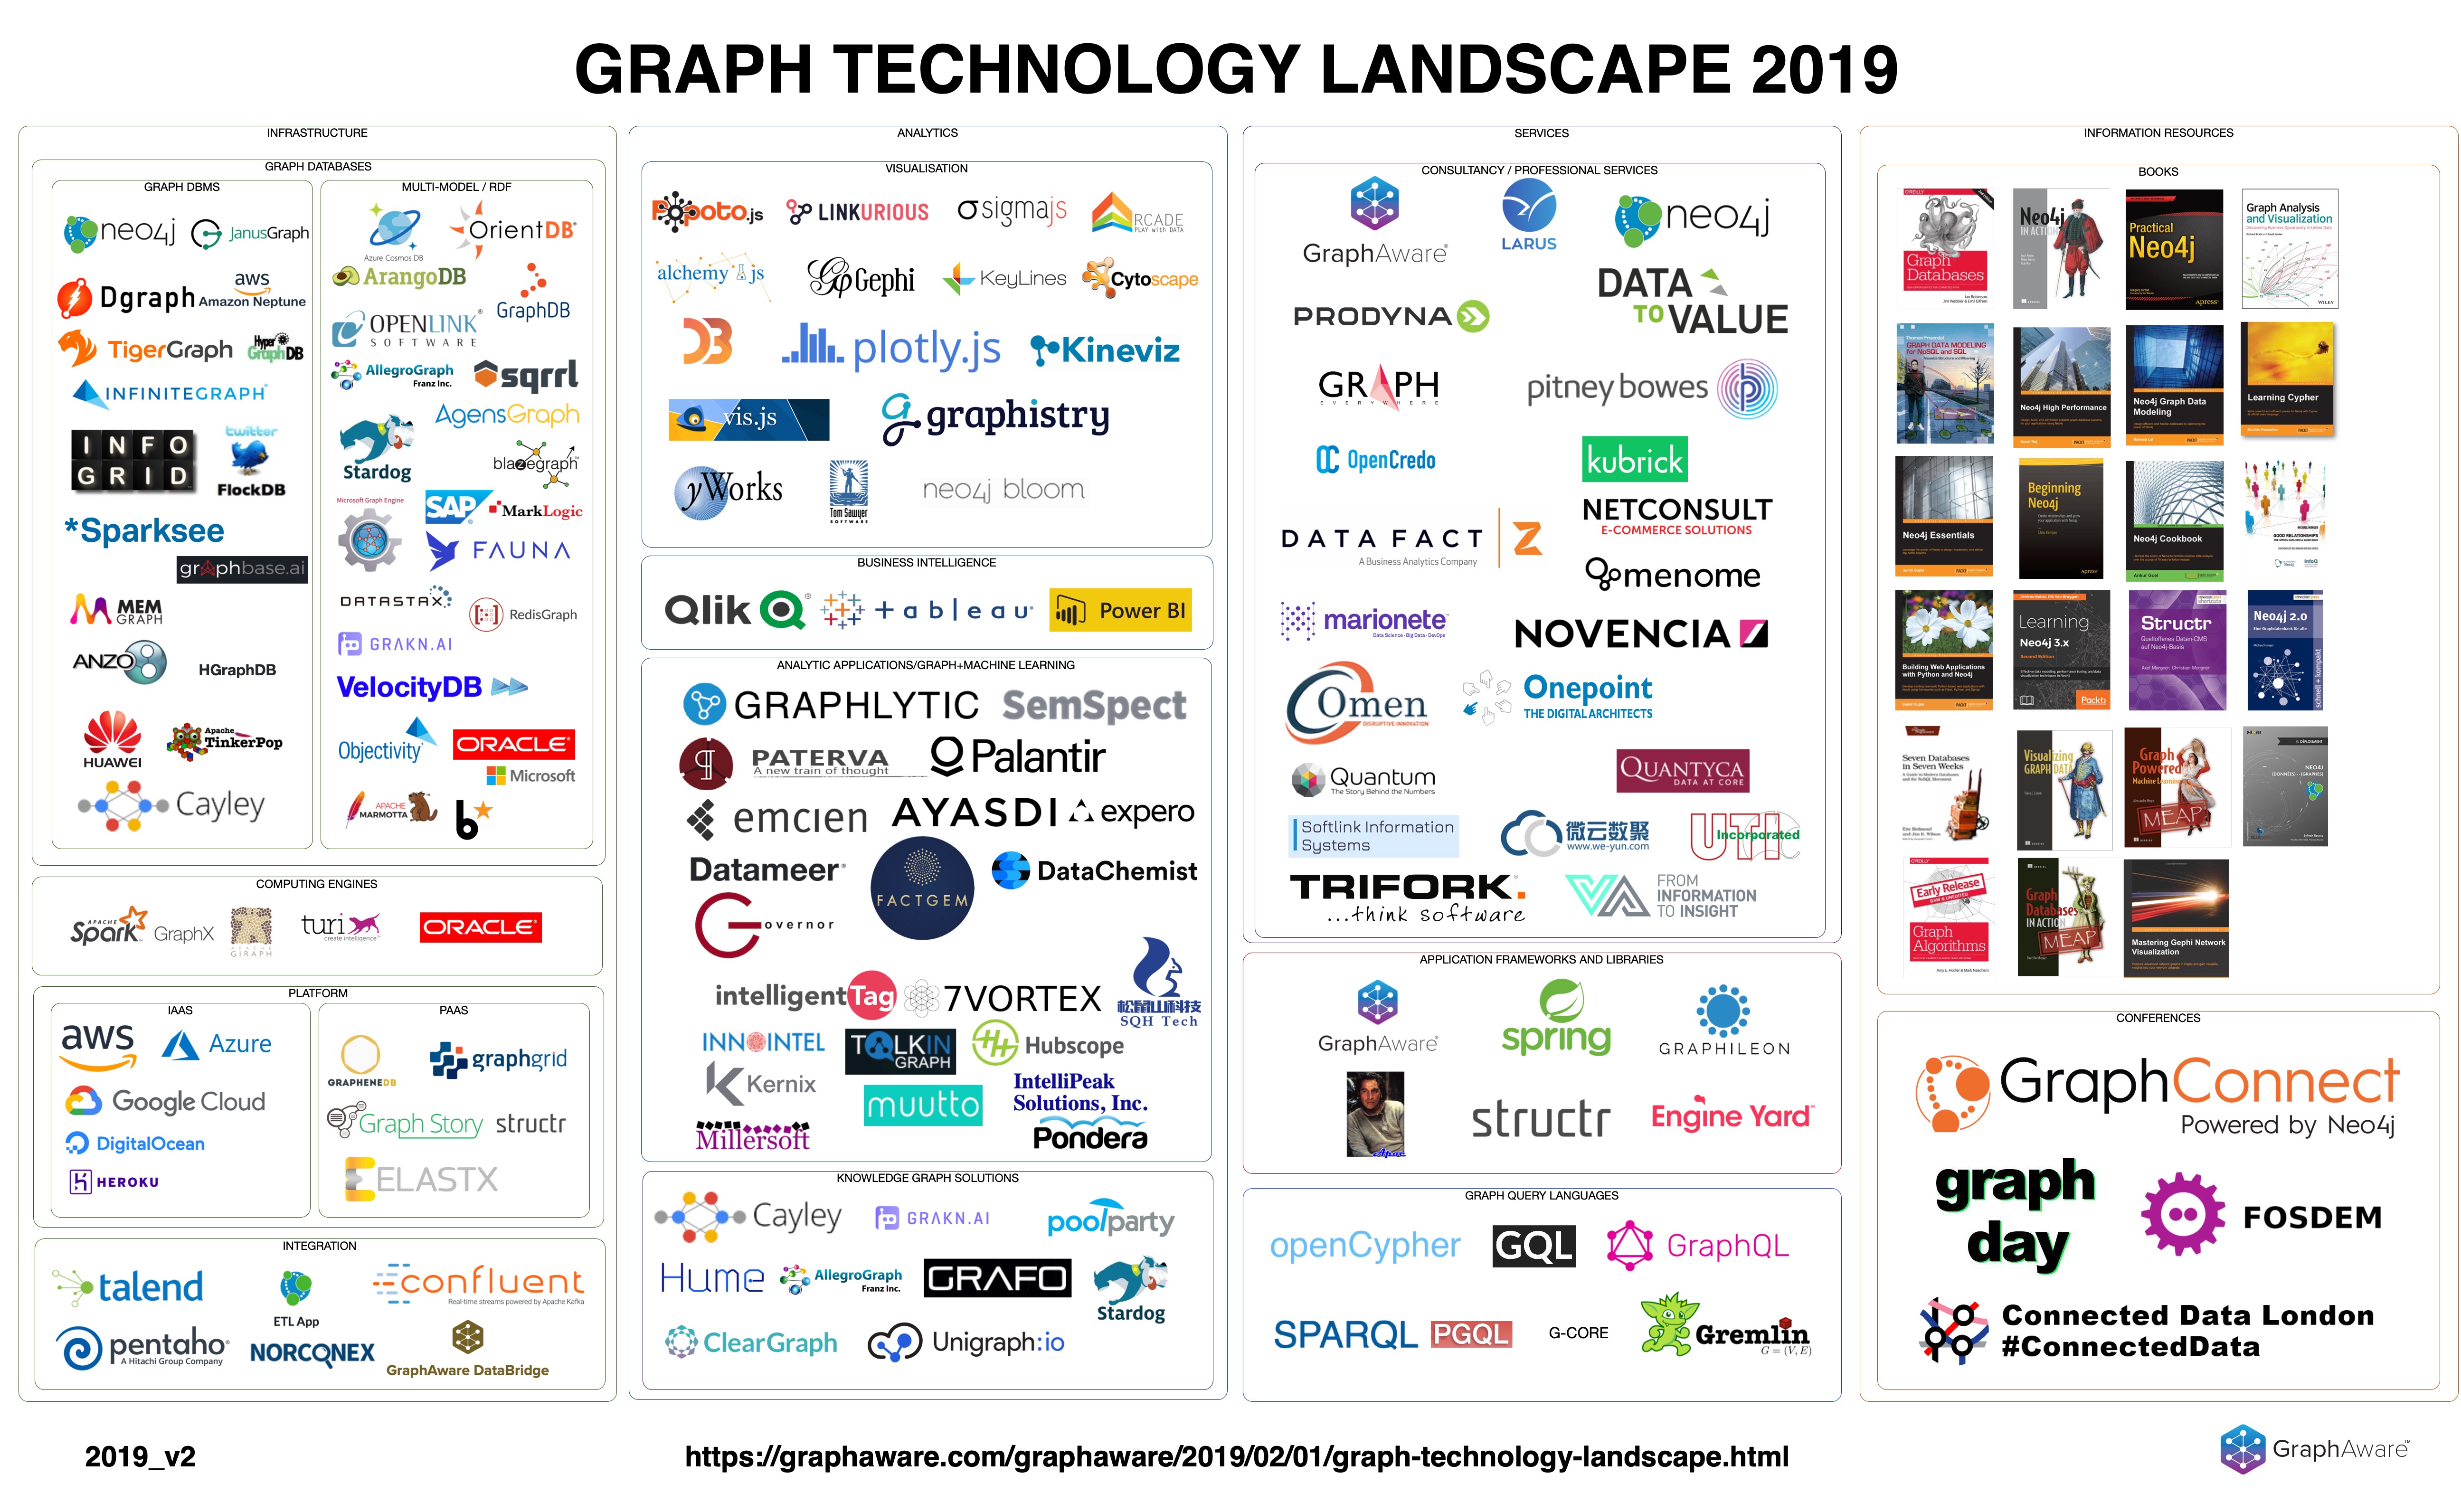
Graph Technology Landscape 2019
This landscape is not something that a market research company created, this is something I created with passion and love, because I believe in graphs. It is it is highly probable that it is not perfect, and of course, we at GraphAware see this entire World through our “Neo4j expert” eyeglasses.
All graph technology landscapes include Apache Tinkerpop, an open source graph computation framework, and Gremlin, its query language. Gremlin, as opposed to Cypher and SPARQL, is an imperative language (although as Marko Rodriguez pointed out, it can also be used declaratively). Using Gremlin imperatively means users are in control of how traversals are executed, in effect writing their own query plans. Here Ian Robinson with Kelvin Lawrence from AWS show how to use Gremlin query hints in AWS Neptune.

Introducing Gremlin query hints for Amazon Neptune
Amazon Neptune supports W3C RDF graphs that can be queried using the SPARQL query language. It also supports Apache TinkerPop property graphs that can be queried using the Gremlin graph traversal and query language. In this post, we look at some new features available for Gremlin users. Specifically, we focus on the new query hints capability, which gives you greater control over how your queries are executed.
It’s worth noting that although AWS was at the W3C Workshop on Web Standardization for Graph Data, the Tinkerpop community was under-represented. This, however, does not mean they are not interested in this effort. Marko Rodriguez, key member of this community, has stated in a private exchange that they are keeping a close eye on developments.
For Rodriguez, however, it’s all about the bytecode, as the Gremlin virtual machine is language agnostic. It currently supports Gremlin, SPARQL, SQL, Cypher, and more, and all it takes is a mapping for it to support any other query language as well. Rodriguez, in fact, is advocating an extension of Tinkerpop from graph-specific to graph-agnostic for TinkerPop 4.

My thoughts on the future of Apache TinkerPop
My sabbatical gave me the opportunity to step away from TinkerPop/Gremlin codebase and reflect on the “data space” as a whole and to think through the types of problems I want to tackle next. I have come to a bit of a crossroads and I would like to get peoples’ feedback on my thoughts below.
This approach, i.e. mapping queries to Gremlin and then executing them, was used in a benchmark that was recently published by Matteo Lissandrini et. al. The benchmark compares ArangoDB, BlazeGraph, Neo4j, OrientDB, Titan / JanusGraph, and Sparksee. Elaboration on the methodology and the use of Gremlin as part of it is also given here.
Angus Addlesee from Wallscope also published an update on his benchmark comparing AnzoGraph, Blazegraph, GraphDB, Stardog and Virtuoso. Both are remarkable efforts, but each with its own limitations, as also discussed by the authors. We would also note that even the union of offerings tested is limited, while also including products that are not relevant for commercial use.
Benchmarking is hard, and there’s a reason why there are entire projects and organizations such as the LDBC dedicated to this effort.

An Experimental Comparison of Graph Databases
In this work we provide a comprehensive study of the existing systems in order to understand their capabilities and limitations. We introduce a micro-benchmarking framework for the assessment of the functionalities of the existing systems and provide detailed insights on their performance.
Manish Jain, Dgraph Founder & CEO, describes his journey in Google, the gotchas of graph databases, and what lead him to start Dgraph. Dgraph is an open source graph database, available under the Apache 2.0 license. Dgraph does not currently have an enterprise edition, or a known release date for it.
Why Google Needed a Graph Serving System
Word from Google has been limited to serving Knowledge Graph, but nothing has been said about the internal infrastructure which makes this happen. There are specialized systems in place at Google to serve the knowledge graph.
Bill Slawski, Director of SEO Research at Go Fish Digital, dissects a patent recently granted to Google to show how Google extracts entities from web content to populate Knowledge Graphs. In a follow-up post, Slawski does the same for another Google patent, postulating on Entity Normalization.

Google Shows Us How It Uses Entity Extractions for Knowledge Graphs
Google may use entity extractions, entity classes, entity properties, and association scores from pages to build knowledge graphs.
Google can also discover datasets, and linked open data is a great way to publish data. Linked data are great for data consumers: data is discoverable, annotated, semantic, and of course linked. The incentive, and the process, however, are less clear for data publishers. The Linked Open Data cloud has been growing, but not as fast and wide as it could.
David Thoumas from OpenDataSoft talks about how they are trying to change that situation and make data semantization accessible to all. They have put together a semantic chatbot that guides data producers through the process of describing their data with great accuracy, and linking it to other data around the world, in a matter of minutes.

It’s Time To Make Your Data Speak For Itself!
Today, we are very excited to introduce our semantic chatbot. It is designed to help your data gain and maintain sense and reusabality by semantizing it, without even having to understand what data semantization is!
JSON-LD has been pivotal for Linked Data, and it seems to be trending among RDF graph databases too. AllegroGraph just released version 6.5, adding support for JSON and JSON-LD. AllegroGraph joins Ontotext and Stardog which have recently also added support for JSON over MongoDB. This makes 3 RDF graph databases to move towards document in the last few months, in addition to multi-model graph databases that already support this.
AllegroGraph 6.5 Marks First Multi-model Semantic Graph and Document Database via JSON and JSON-LD
Run Graph Queries Across JSON Documents, CSV Files, Semantic Metadata and Unstructured Text
More Linked Data: here Ruben Verborgh from Ghent University / MIT / Inrupt talks about Solid at FOSDEM. Solid is the technology Sir Tim Berners-Lee is pioneering to re-orient the Web to its original vision. Linked Data is a key element of Solid, and Verborgh is a key contributor to Linked Data research and implementation. At the Web’s 30th anniversary, this is more relevant than ever.
Bonus track – the latest publication from Verborgh’s group: Republishing Open Street Map’s roads as Linked Routable Tiles

Solid: taking back the Web through decentralization
Solid is a new ecosystem for the Web, in which people store their own data instead of having to upload it to applications. This changes how we will build apps: we no longer have to harvest people’s data, but ask permission to access people’s data space.
At Connected Data London, we care about the Web, and Linked Data. We are back, so mark the dates, and the venue: October 3 and 4, Hilton Doubletree Tower of London. Announcing first speakers, workshops and webinars for 2019, it’s more Connected, more Data, and more London than ever! And we got Meetups too, in London and in Berlin.
* Ruben Verborgh from Ghent University/MIT/Inrupt will share his insights on new paradigms for Linked Data, and how to drive adoption and approachability.
* Jono Alderson from Yoast will share how JSON-LD and schema.org help him acquire more customers, grow businesses, and prepare for the future.
* David Gorena from Microsoft will show how AI and knowledge are infused in Microsoft Office.
* Paco Nathan from Derwen/O’Reilly will explore the best ways to mix Data Science and Machine Learning with Knowledge Graphs.

More Connected, More Data, More London: Connected Data London 2019
From Microsoft Office to Inrupt Solid. From knowledge graphs to machine learning. From business strategy to Javascript and JSON-LD for semantic SEO. Whatever makes you tick, you will find it in Connected Data London 2019.
One of the most common application domains for graph is finance. Finding relations between transactions and users is something that can be useful for a number of reasons. Here, we have 2 examples of how this can be done for blockchain. Cesar Pantoja from TokenAnalyst shows how to load Bitcoin into Neo4j in one day, and Thomas Silkjær from 2K/DENMARK shows how to use graphs for pattern detection and fraud investigation in the XRP ledger.
The XRP Ledger And Graphs: Pattern Detection And Fraud Investigation
The third part in series on how graph databases can be used to explore and analyse the decentralised XRP ledger. This third part focuses on exploring networks of fraudulent accounts and distribution patterns.
Finance is one of the domains in which versioning and provenance for graphs may be needed. Both are tricky topics, in graph as everywhere else. Here Stefan Bieliauskas from casecheck shows how to use the W3C PROV standard with Neo4j. On a related note, Tom Geudens shows how to add versioning to Neo4j models.
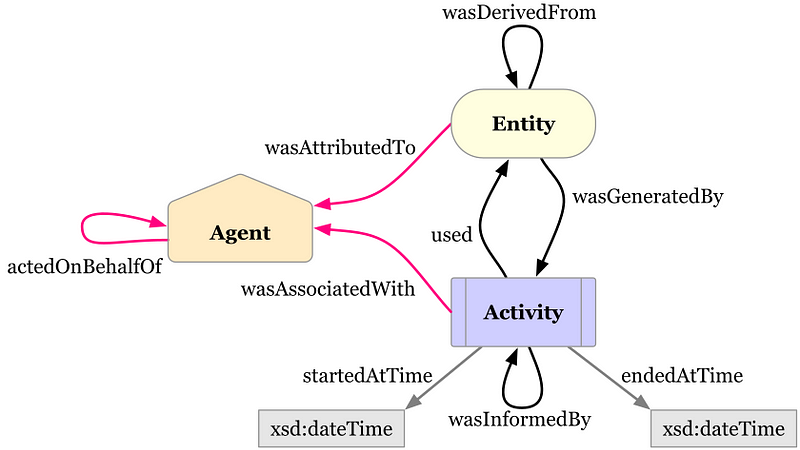
Getting started with Provenance and Neo4j
We all want to know “Where does our meat come from?” or “Is this a reliable information or fake news?”. If we ask this kind of questions it is always about the Provenance of information or physical objects
Jan Zak and Luanne Misquitta from GraphAware show how graph algorithms and graph models are used in practice, for speaker identification and lean dependencies for project management respectively.
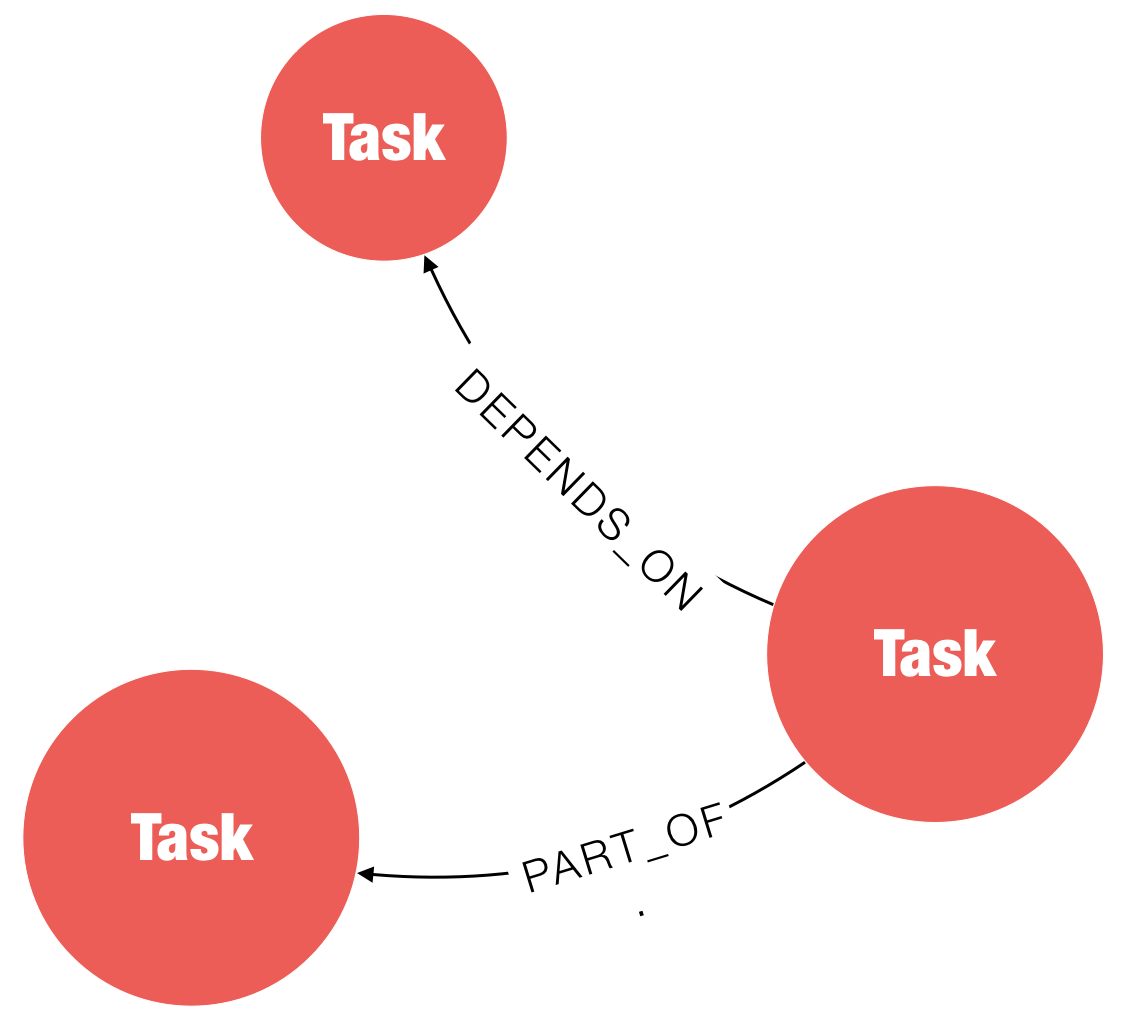
Lean Dependencies – Reduce Project Delivery Chaos with Graphs
Dependencies, like graphs, are everywhere. Achieving a goal is rarely possible in a vacuum and requires collaboration between individuals and/or processes. Eliminating dependencies completely is unrealistic- they are a part of life- but they can be streamlined to improve efficiency and reduce friction.
Wrapping up, a few academic publications, and a science hack on graphs. Adrian Colyer presents a Comprehensive Survey on Graph Neural Networks by Wu et al, Zhou et al show how to Improve Image captioning by Leveraging Knowledge Graphs, and Tai-Danae Bradley shows how Matrices & Probability can be seen as Graphs
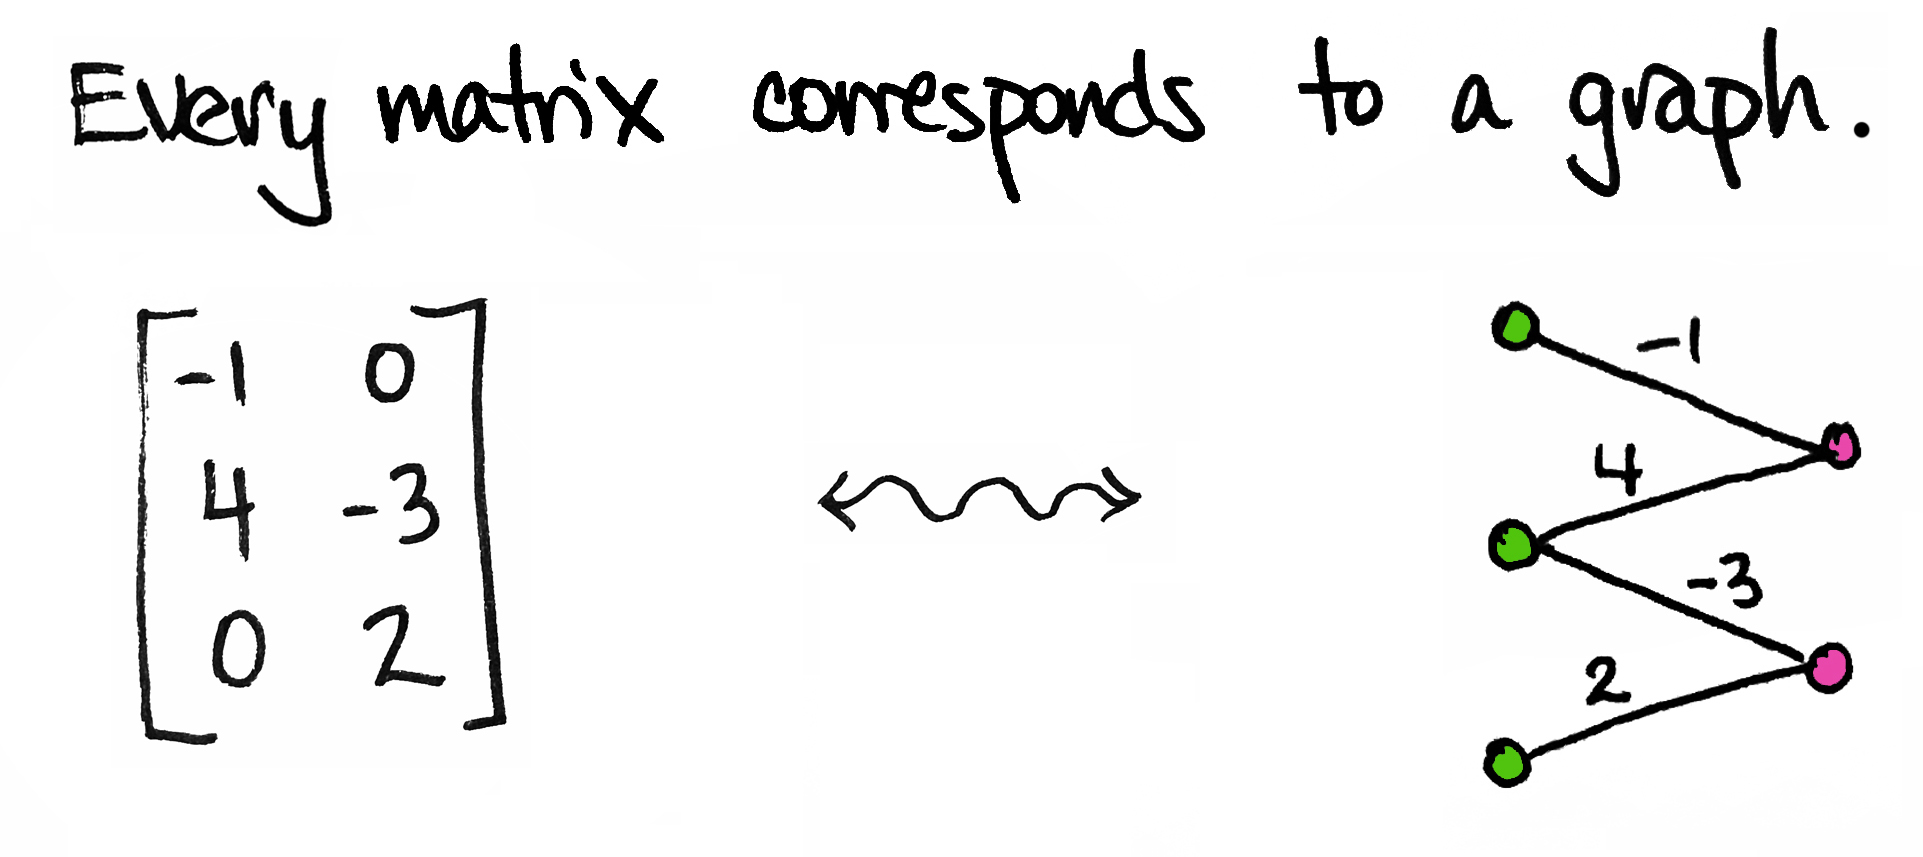
Viewing Matrices & Probability as Graphs
Today I’d like to share an idea. It’s a very simple idea. It’s not fancy and it’s certainly not new. In fact, I’m sure many of you have thought about it already. But if you haven’t—and even if you have!—I hope you’ll take a few minutes to enjoy it with me.
Related posts:
 Graph explosion and consolidation. The Year of the Graph Newsletter Vol. 14, June 2019
 Graphs in the cloud. The Year of the Graph Newsletter Vol. 12, April 2019
 Graph gets funding. The Year of the Graph Newsletter Vol. 7, November 2018
 The evolution of the graph technology and business landscape in 2025. The Year of the Graph Newsletter Vol. 27, Spring – Summer 2025

