Graph explosion and consolidation. The Year of the Graph Newsletter Vol. 14, June 2019

With the knowledge graph space exploding on all accounts (interest, use cases, funding), centrifugal and centripetal forces are simultaneously at play. While the “wild, early days” of knowledge graph technology are gone, the 20 year anniversary of the Semantic Web is a good opportunity to reflect on what worked and what didn’t, and to move forward in a pragmatic way.
A testament to the fact that this space is booming: more offerings are available every day, the quality and quantity of knowledge sharing is rising to meet the demand, and at the same time we are starting to see consolidation – in vendors, models, and standards.
The Future of Data is Connected and Open Minded. This was the takeaway from Connected Data London 2018, as well as the connection to naturally take us to Connected Data London 2019. In other words, the future is graph – knowledge graph. Connected Data London has announced keynotes from Uber, Microsoft, and Siren.io, and workshops with some of the world’s leading experts.

The future is Graph – Knowledge Graph
Today we are announcing our Keynote Speakers from Uber, Microsoft and Siren.io, taking us on a tour de graph. The full programme of the Connected Data Labs, our workshops with some of the world’s leading experts sharing their hands-on knowledge, is out too. Plus a slew of more exciting speakers, ranging from the cutting edge to the mainstream.
Giovanni Tummarello, Siren.io CPO, is one of Connected Data London’s keynote speakers. Here Tummarello offers a bit of history on the wild, early days of graph databases, where they fell short, why they are hot again and what they are unbeatable at, and the concept of “Enterprise Wide Knowledge Graphs”.

Graph DBs in Enterprise: Top 3 use cases in which they make sense
In Siren, we provide “Enterprise Wide Knowledge Graph”, which means we connect to one or more sources your data where it naturally lives (e.g. Elasticsearch for huge logs, DBMS, Hadoop) and purely via UI configuration (no ETL) make all the data look and feel like a huge enterprise knowledge graph.
The “wild, early days of graph databases” are to a large extent tied to the concept of the Semantic Web. The 20-year anniversary mark for the Semantic Web has inspired some people to share their thoughts. Pierre-Yves Vandenbussche from Elsevier Labs notes that the Semantic and Web parts may actually be at odds with each other, but pragmatism seems to be on its way to prevailing.
Linked Data – Past, present (2019) and future
The AI / ontology implication fails to address most of real world data on the Web that is uncertain, incomplete, inconsistent and includes errors. The adoption of Semantic Web turned out to be different from its original vision, focusing on a more pragmatic use for data representation and integration, data linking. Linked Data are born!
Ruben Verborgh from University of Ghent / MIT / Inrupt identifies the Semantic Web’s identity crisis, arguing “the community has an unconscious bias toward addressing the Paretonian 80% of problems through research—handwavingly assuming that trivial engineering can solve the remaining 20%. In reality, that overlooked 20% could actually require 80% of the total effort and involve significantly more research than we are inclined to think”.
Case in point: Verborgh’s work on Solid, which promises the separation of data and apps, so we can choose our apps independently of where we store our data. Building such decentralized Linked Data apps necessitates a high level of interoperability, where data written by one app needs to be picked up by another.
Rather than relying on the more heavy Semantic Web machinery of ontologies, Verborgh believes that shapes are the right way forward — without throwing the added value of links and semantics out of the window. Verborgh will talk about Connecting people, data, and apps without centralization in Connected Data London.

Shaping Linked Data apps
In this post, I will expand on the thinking that emerged from working with Tim Berners-Lee on the Design Issue on Linked Data shapes, and sketch the vast potential of shapes for tackling crucial problems in flexible ways.
Semantics are very relevant in business data management. Internal and external concepts relevant to the business is what Andreas Ingvar van der Hoeven from GeoPhy calls the semantic universe. Van der Hoeven goes on to define a who is who in the Semantic world, and what are the professions of Taxonomist, Data Librarian, Ontologist and Semantic Architect.

The Semantic Heroes
The Semantic universe is the representation of internal and external concepts relevant to the business. Every concept is unambiguously defined. The concepts are linked to each other. They have some attributes, and some of them contain a finite list of individual instances described in a way that distinguishes them from other instances of the same concept.
Ontologies are a substrate for knowledge graphs, but building them can be intimidating and complex for beginners. C. Maria Keet published the requirements, design, and content of the African Wildlife Ontology tutorial to breathe some fresh air into ontology building for beginners. And for a hands-on education, don’t forget Panos Alexopoulos’ session in Connected Data London.
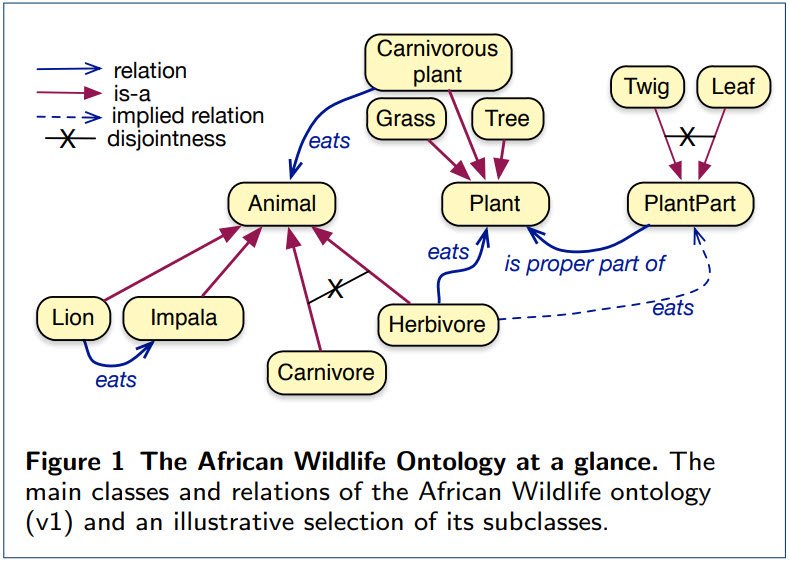
The African Wildlife Ontology tutorial ontologies: requirements, design, and content
We identified 22 requirements that a good tutorial ontology should satisfy regarding subject domain, logics and reasoning, and engineering aspects. We developed a set of ontologies about African Wildlife to serve as tutorial ontologies.
Seasoned ontologist Chris Mungall continues to share his expertise, on mapping and documenting ontologies.

Never mind the logix: taming the semantic anarchy of mappings in ontologies
Mappings between ontologies, or between an ontology and an ontology-like resource, are a necessary fact of life when working with ontologies. These mappings can be used for a variety of purposes, such as data integration – data annotated using different ontologies can be ‘cross-walked’ to use a single system.
Steve Baskauf is a Data Curation Specialist with the Jean & Alexander Heard Libraries at Vanderbilt, whose group is interested in using Wikidata. Baskauf gets the fact that Wikidata’s SPARQL endpoint, like any other SPARQL endpoint, is a powerful API, and showcases how to get data out of Wikidata using SPARQL in his post.
In complementary work, Heibi, Peroni and Shotton show how to enable text search on SPARQL endpoints, also using Wikidata as an example.
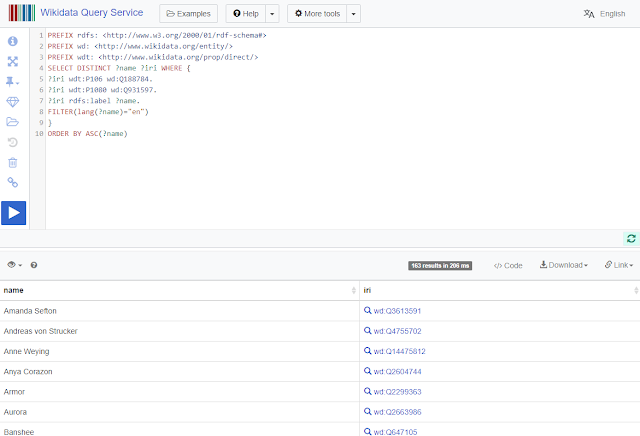
Getting Data Out of Wikidata using Software
I have been surprised to hear people complain that Wikidata doesn’t have a good API that people can use to acquire data to use in applications such as those that generate web pages. When I mentioned that Wikidata’s query service effectively serves as a powerful API, I got blank looks from most people present. Underneath it all, the query service is a SPARQL endpoint: a glorified, program-it-yourself API.
DBpedia is another one of the main hubs in the Linked Open Data world. In its community day in Leipzig there was an array of presentations on all things DBpedia. Some of the most interesting ones: Heiko Paulheim on harvesting knowledge graph data from wikis, and Maribel Acosta on crowdsourcing knowledge graph quality assessment.
From Wikipedia to Thousands of Wikis – The DBkWik Knowledge Graph
Extracting Wikis with the DBpedia extraction framework is possible, but results in many isolated knowledge graphs. We show how to create one consolidated knowledge graph, called DBkWik, from thousands of Wikis. We perform entity resolution and schema matching, and show that the resulting large-scale knowledge graph is complementary to DBpedia.
What happens when you try to extract knowledge using multiple, sometimes contradictory, data sources? This is the question Mos Zhang from SyncedReview is looking into, using BERT and ERNIE, a pretrained model and a model leveraging knowledge graphs, respectively.
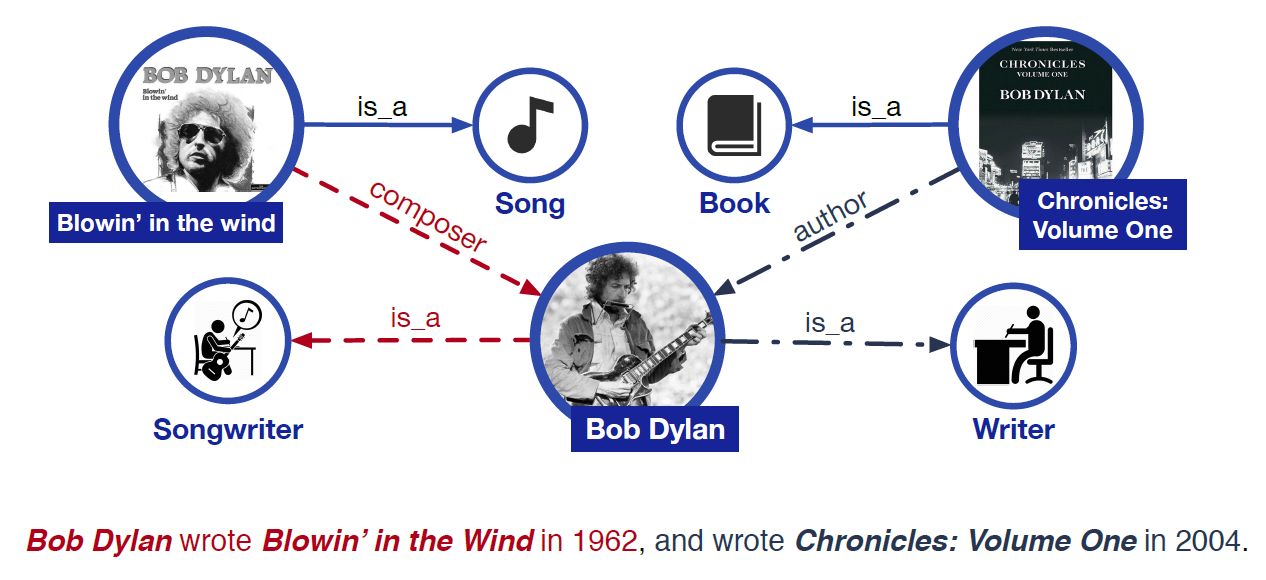
Ask AI: Is Bob Dylan an Author or a Songwriter?
Google’s pretrained model BERT (Bidirectional Encoder Representations from Transformers) has become one of the hottest AI tools for Natural Language Processing (NLP). BERT has an unprecedented ability to capture rich semantic meanings from plain text, but it’s not quite perfect. Researchers recently proposed a new model that incorporates knowledge graphs (KG) into training on large-scale corpora for language representation. In a nod to the Sesame Street characters, the new model was named “ERNIE.”
data.world has been working on leveraging the benefits of semantics and knowledge graph technology for enterprise data management. Now it joins forces with Capsenta, adding virtulization and consumer grade UI to its arsenal, in an acqui-hiring move that seems like a perfect match both technologically and culturally.
Data.world joins forces with Capsenta to bring knowledge graph-based data management to the enterprise
data.world has been expanding its footprint in the enterprise. The acqui-hiring of Capsenta complements its portfolio with knowledge graph virtualization to connect data in the cloud and on premise, and a UI to build knowledge graphs.
In the last few days, we also had an array of news from vendors who may not the first that come to mind when thinking of graph databases, but are making a graph data play in one way or another.
Cray will be acquired by Hewlett Packard Enterprise. Cray offers, among others, a RDF graph database, which will now become HP’s property.
Fluree is a startup working on FlureeDB, promising that rather than building expensive APIs, developers are able to safely expose rich and permissioned query interfaces to data sources including GraphQL, SPARQL, and Fluree’s JSON-based FlureeQL. Fluree just raised $4.73 million in seed funding.
RavenDB, an open-source transactional NoSQL document database vendor, has added data replication and other features to the latest release along with the ability to handle graph queries in its own query language.
Another startup, Oxford Semantic Technologies, is working on RDFox, its own graph database. Angus Addlesee from Wallscope has a go at RDFox and adds it as a contender to his RDF graph database benchmark.
Last but not least, Wolfram now supports importing and exporting RDF data, as well as querying with SPARQL.
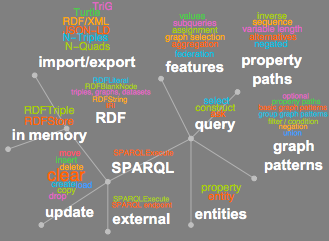
RDF and SPARQL in Wolfram 12
Version 12 introduces experimental support for importing and exporting RDF (Resource Description Framework) data as well as executing SPARQL queries—both on in-memory data as well as on remote SPARQL endpoints (RDF graph databases).
DataStax has added graph to its database offering a long time ago. Now if you have DataStax Enterprise core, and DataStax Graph, and Developer Studio, the new DataStax Desktop will configure all of those to work together seamlessly, and you don’t have to touch a single line of configuration files.
DreamWorks is a DataStax user, and although their team had no previous experience in graph databases, having historically relied on relational DBs, they were brave enough to try – after hearing about how graph was applied at Netflix. They used Apache Tinkerpop and Gremlin for this.

DreamWorks picks Gremlin to weave digital marvels
We built a mock show. And in doing that we proved that yes, you can use graph for this purpose. This is the heart of the machine – literally our entire process would be in this graph database. And it is – we’re about to go live with this on our next feature.
Ontotext has just released the latest version of GraphDB, 8.10. In this version, the key new feature is support for JavaScript.

GraphDB 8.10 Makes Knowledge Graph Experience Faster and Richer
GraphDB 8.10 now features an open-source GraphDB JavaScript access driver. Another new feature in GraphDB 8.10 enables developers to push server-side JavaScript functions and use them as custom SPARQL functions. Ontotext has also improved and optimized the semantic graph database’s performance with plugin and connector parallelization, and enhanced semantic similarity searches.
Stardog also has not one, but two new versions out: 6.2 and 7.0 Beta 2. Stardog 6.2 brings scalable virtual graph caching, better Kubernetes integration, support for Amazon Redshift, and many new optimizations. Stardog 7.0’s features a new storage engine, with substantially faster write performance, especially when running in a cluster.
Stardog 7.0 Beta 2
We’re happy to announce the release of Stardog 7.0 Beta 2, complete with lots of changes designed specifically to help make the world’s best Knowledge Graph even more awesome.
In Neo4j’s world, we have a couple of updates (the Neuler graph algorithm playground and Bloom), use cases (Women’s World Cup data as a graph, and graph databases for journalists), and a tip – how to calculate TF-IDF score using cypher.

Using graph algorithms to explore the participation of shell companies in public procurement
This is the 2nd in a series of posts on showing how to analyze open contracting data using Neo4j. The Open Contracting Data Standard (OCDS) is a global, non-proprietary data standard designed to reflect the entire contracting life-cycle. It was created to increase contracting transparency and facilitate deeper analysis of contracting data by a wide range of users.
TigerGraph also has its own suite of open source graph algorithms, written in GSQL, its own query language. If you want to learn more about graph query languages and GSQL, and how they are used in fraud detection in the finance sector, you can also check TigerGraph’s webinar with Connected Data London.
And to follow that up: TigerGraph has come up with a way to use FIBO, the Financial Industry Business Ontology (FIBO), in its property graph platform.
Sink your teeth into FIBO with a native parallel graph database
After multiple TigerGraph implementations for customers on semantic technologies, we were curious about loading The Financial Industry Business Ontology (FIBO) into our property graph. We found it was very easy to do, and this has given us a newfound appreciation of how interoperable different graph technologies are and how knowledge encoded in FIBO can be leveraged in TigerGraph applications.
The Graphileon application development framework comes with a large set of stylable user interface widgets for software development. Users can develop insightful visualizations as they develop graph analytics. Graphileon has announced new partnerships with Cambridge Semantics and DataStax in the last few days.
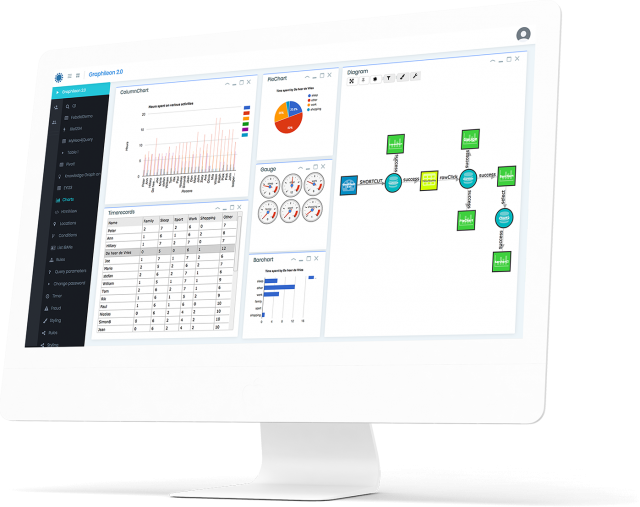
Graphileon to Support DataStax Enterprise Graph
DataStax, the company behind the leading database built on Apache Cassandra™, today announced a technology partnership with Graphileon to include support for DataStax Enterprise Graph (DSE Graph) on Graphileon’s application development platform. Developers using DSE Graph will now be able to leverage Graphileon’s platform for simpler coding and easier visualization of graph data.
One thing which should be clear about graph databases by now is that there a lot of those around, and choosing one is not easy. Sabah Zdanowska shares her experience Getting to Grips with Graph Databases.

Getting to grips with graph databases
By conducting user research, I gained an understanding of how end users such as investigative journalists and analysts based in commercial banks viewed the usefulness of graph databases, the possible applications and how they felt about how data is visualised on the front-end. Important if the technology is to be successfully utilised.
Alastair Green has been driving the effort to converge various graph query languages into a new standard called GQL. As he reports, the effort seems to be well under way, with the GQL standard project up for final vote in ISO/IEC ballot.

Critical milestone for ISO graph query standard GQL
Plans to create a standard property graph query language GQL took a critical step forward on Friday June 14th. A year ago over 3,000 people took the opportunity to say “Yes to GQL” by voting in an open web poll for The GQL Manifesto, launched in mid-May 2018. Now the industry has responded.
Related posts:
 The evolution of the graph technology and business landscape in 2025. The Year of the Graph Newsletter Vol. 27, Spring – Summer 2025
 Graph Therapy. The Year of the Graph Newsletter Vol. 20, June / May 2020
 A gravitational wave moment for graph. The Year of the Graph Newsletter Vol. 11, March 2019
 Graphs, analytics, and Generative AI. The Year of the Graph Newsletter Vol. 25, Winter 2023 – 2024

