Graphs in the cloud. The Year of the Graph Newsletter Vol. 12, April 2019

The first signs of convergence in the graph space is here. Graph databases continue to grow, expand, and make their way to the cloud, a number of open source frameworks for working with graphs has been released, and a slew of new interesting use cases.
One of the takeaways of the recent W3C Workshop on Web Standardization for Graph Data was that the idea of convergence between RDF and Property Graphs (the 2 different approaches in modeling graphs) seems to be getting traction, and RDF* is key to this. Kurt Cagle picked up on this too in his Forbes piece, and it wasn’t too long before we had the first tangible sign:
Cambridge Semantics, a RDF Graph Database vendor, announced support for OpenCypher, the property graph query language based on Neo4j’s Cypher. This will be based on AnzoGraph’s existing support for RDF*, and it will be the first time a graph database supports both SPARQL and Cypher.
Although there is the precedent of AWS Neptune, which also supports both RDF and Property Graphs, the difference is that Neptune does this with 2 different engines which do not share data, and can be queried via SPARQL and Gremlin respectively.
The Coming Merger Of Property And Semantic Graphs
Property graphs are better at traversal, while semantic graphs are generally more optimized for metadata. Realistically, though, most graphs have the need for both requirements. Graph traversal becomes critical when attempting to determine envelopes. Similarly, reification does become important when talking about the reliability of assertions.
Gremlin is the Property Graph query language which has been developed as part of Apache Tinkerpop. Tinkerpop is based on the idea of a graph virtual machine abstracting graph operations. This has enabled a number of bridges from query languages other than Gremlin to be developed for Tinkerpop, making it a universal graph engine of sorts.
Marko Rodriguez, Tinkerpop’s co-creator and one of its main contributors, wants to take things to the next level. Rodriguez started Tinkerpop along with Titan, a now defunct open source graph database which has been forked as JanusGraph, while working with Aurelius. Aurelius has been acquired by DataStax in 2015, and Rodriguez has been working on Tinkerpop 3.x with DataStax since.
Rodriguez wants to continue his work with Tinkerpop 4, and has published a call for funding through his new firm, RReduX. How to fund foundational open source work like this is something that goes beyond just graph databases.

The Fabled GMachine
Even within the graph space, where different representations abound, the various RDF and property graph formats can be losslessly mapped to each other. Thus, the concepts of a list, a map, a table, a row, a document, a graph, etc. are all simply terms referring to recurring value/pointer-patterns within the GStructure. Data flows through the process graph, where the interconnected functions map, filter, aggregate, and ultimately yield a result.
Tinkerpop 4 is all about the cloud, and it goes beyond just graph databases. The same also applies to Google’s recent move to announce it has reached a deal with a number of open source data vendors to host their offerings on Google’s cloud, under a revenue share scheme.
Neo4j was among those select 7 vendors that were initially announced. It will be interesting to see whether the initial cohort will be expanded with other graph databases too.

What’s Next for Graphs: Neo4j for Google Cloud
It’s official: To a sold-out crowd at Google Cloud Next ’19 today, we’ve formally announced a new strategic partnership with Google Cloud that delivers Neo4j as a fully managed service deeply integrated with the Google Cloud Platform. Now every GCP user has access to graph superpowers – without having to worry about operations and management – enabling them to focus on what they care about most: building applications in the cloud.
ArangoDB is a (multi-model) graph database that also announced important news last month. ArangoDB received a series A funding round of $10M led by Bow Capital, and is working on ArangoDB Oasis, a managed service that will run on AWS, Azure, and Google Cloud.
ArangoDB Oasis. The Managed Service for ArangoDB
ArangoDB Oasis is the managed service for ArangoDB, build and supported by the people creating the distributed systems at ArangoDB. Oasis provides fully hosted, managed and monitored cluster deployments of any size. Focus on your application, our specialists takes care of the rest.
More graph query language evolution in the aftermath of the W3C Workshop. TigerGraph is working on some extensions to GQL, its query language. GQL 2.4 now supports pattern matching, and support for accumulators is coming soon, too.
Hansel and Gretel & big data analytics with graphs
As I thought about the best way to explain accumulators, a key feature in TigerGraph’s graph query language – GSQL, I realized that it has something in common with a story from our childhood – the story of Hansel and Gretel. Accumulators in GSQL can serve as the “pebbles” in graph traversal algorithms. Accumulators come with built-in computational functions and data structures, and they are designed to work with parallel computation.
Even more open source graph databases. eBay has just open sourced Beam, a distributed RDF store. Beam is designed to store large graphs that cannot fit on a single server. It’s scalable in how much data it can store and the rate of queries it can execute, but there are some architectural limitations.
All changes to the graph go through a central log, which fundamentally limits the total rate of change, and it’s not ready for production-critical deployments. Beam’s query language is not quite compatible with SPARQL, and its inference engine is limited.

Beam, a distributed knowledge graph store
Beam is a distributed knowledge graph store, sometimes called an RDF store or a triple store. Knowledge graphs are suitable for modeling data that is highly interconnected by many types of relationships, like encyclopedic information about the world. A knowledge graph store enables rich queries on its data to complement machine learning applications.
When is a graph database a good match for your use case? Optum’s Dan McCreary has been doing a deep dive into when to apply graph technologies in a large fortune 10 healthcare company, and distills his experience in a taxonomy of graph use cases. McCreary expands his analysis to explain why Knowledge Graphs are the Third Era of Computing.
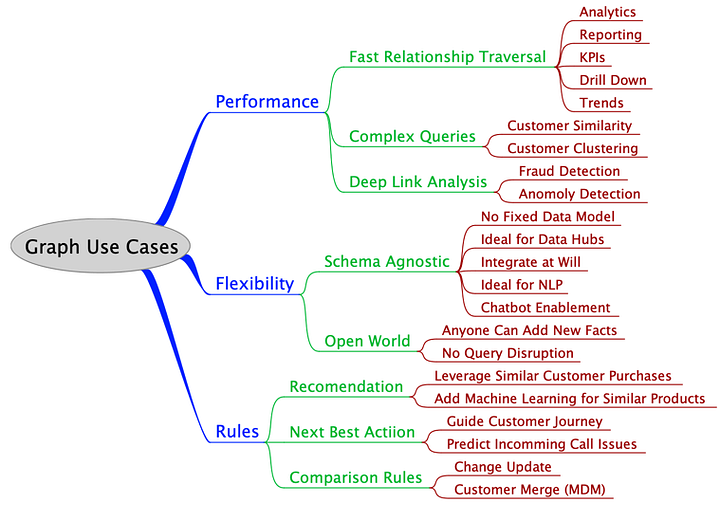
A Taxonomy of Graph Use Cases
For the past year I have been doing a deep dive into when to apply graph technologies in a large fortune 10 healthcare company. I have worked with hundreds of teams and thousands of people from a wide variety of domains. When I started this process I had a small checklist in my mind about what types of problems were a good fit for graphs.
What about modeling strategies / patterns for building knowledge graphs? Chris Mungall from Berkeley applies those to core biological knowledge (e.g. relations between genes, chemicals, diseases, environments, phenotypes, diseases, variants). He calls these patterns Knowledge Graph Modeling and OWL (aka logical) modeling. Mungall says these are complementary and can work together, but finds it useful to be aware of the ‘mode’ one if working in.
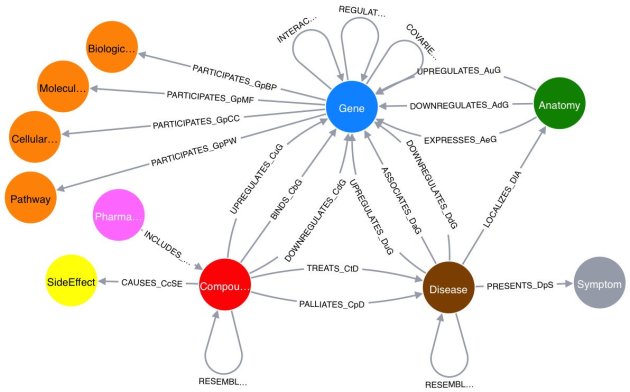
Biological Knowledge Graph Modeling Design Patterns
I don’t have a formal definition of ‘knowledge graph’. I realize it is in part a marketing term, but I think there are some key features that are commonly associated with KGs that may distinguish them from the way I have modeled things in RDF/OWL.
Ozymandias is a proof-of-concept biodiversity knowledge graph by Rod Page. The core of this knowledge graph is a classification of animals from the Atlas of Living Australia (ALA) combined with data on taxonomic names and publications from the Australian Faunal Directory (AFD). Also queryable via SPARQL.
The graph has been enhanced by adding lots of digital identifiers (such as DOIs) to the publications and, where possible, full text. Identifiers enable to further grow the knowledge graph, for example by adding “cites” and “cited by” links between publications (data from CrossRef), and displaying figures from the Biodiversity Literature Repository (BLR).
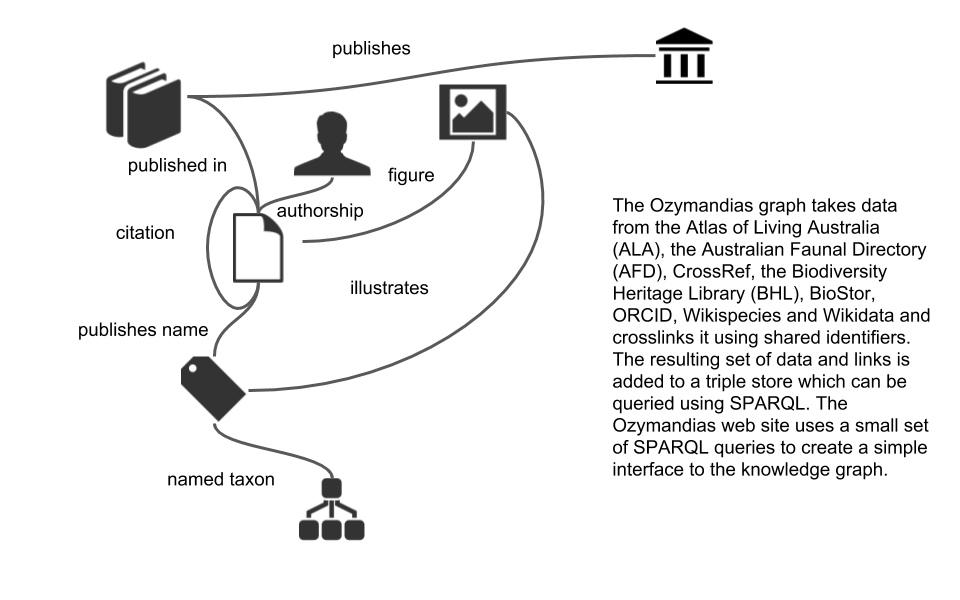
Ozymandias – a biodiversity knowledge graph
The knowledge graph is implemented as a triple store where the data has been represented using a small number of vocabularies (mostly schema.org with some terms borrowed from TAXREF-LD and the TDWG LSID vocabularies). All results displayed in the first two panels are the result of SPARQL queries, the content in the rightmost panel comes from calls to external APIs.
More use cases from Neo4j. The consumer choice illusion exposed via graphs, and how to keep calm and drink tea, graphing Britain’s most beloved hot beverage.

The Illusion of Consumer Choice: A Tale of Cereal and Knowledge Graphs
A handful of large companies – about 10 – make up the vast majority of products available for purchase in the average grocery store. You might be standing in the cereal aisle, trying to decide among dozens of options. But no matter which cereal you choose, chances are your money ultimately goes to one of a very few companies. I figured it’d be interesting to load this information into the Neo4j graph database and see what we might be able to do with it.
Graphs are meant to be seen, visualization speeds up data analysis. Elise Devaux from Linkurious concludes with the 3rd part of mapping the graph ecosystem in 2019, on graph visualization.

The Graphtech ecosystem 2019 – Part 3: Graph visualization
Visualization of information has been the support of many types of analysis, including Social Network Analysis. For decades, visual representations have helped researchers, analysts and enterprises derive insights from their data. Visualization tools represent an important bridge between graph data and analysts. It helps surface information and insights leading to the understanding of a situation, or the solving of a problem.
Facebook AI Research (FAIR) announced the open sourcing of PyTorch-BigGraph (PBG), a tool that makes it faster and easier to produce graph embeddings for extremely large graphs — in particular, multi-relation graph embeddings for graphs where the model is too large to fit in memory.
FAIR claims PBG is faster than commonly used embedding software and produces embeddings of comparable quality to state-of-the-art models on standard benchmarks. With this new tool, anyone can take a large graph and quickly produce high-quality embeddings using a single machine or multiple machines in parallel.

Open-sourcing PyTorch-BigGraph for faster embeddings of extremely large graphs
Graphs are a core tool to represent many types of data. They can be used to encode networks of related items, such as facts about the world. For example, knowledge bases like Freebase have various entities (e.g., “Stan Lee” and “New York City”) as nodes and edges that describe their relationships (e.g., “was born in”).
Accenture also open sourced AmpliGraph, a Python library that predicts links between concepts in a knowledge graph. AmpliGraph is a suite of neural machine learning models for relational Learning, a branch of machine learning that deals with supervised learning on knowledge graphs.
AmpliGraph’s machine learning models generate knowledge graph embeddings, vector representations of concepts in a metric space. It then combines embeddings with model-specific scoring functions to predict unseen and novel links.

AmpliGraph. Open source Python library that predicts links between concepts in a knowledge graph
Use AmpliGraph if you need to:
* Discover new knowledge from an existing knowledge graph.
* Complete large knowledge graphs with missing statements.
* Generate stand-alone knowledge graph embeddings.
* Develop and evaluate a new relational model.
Salesforce Research is also working on predicting unseen and novel links in Knowledge Graphs, and has open sourced the code they use for this. Victoria Lin, research scientist at Salesforce and the primary author of a paper on Multi-Hop Knowledge Graph Reasoning with Reward Shaping that details this work, spoke to ZDNet about this.

Salesforce Research: Knowledge graphs and machine learning to power Einstein
Explainable AI in real life could mean Einstein not just answering your questions, but also providing justification. Advancing the state of the art in natural language processing is done on the intersection of graphs and machine learning.
The DICE research group at the University of Paderborn just released DEER 2. DEER is an open source framework for RDF dataset enrichment: targeted insertion and deletion of triples in existing RDF datasets.
This could be conforming data from general knowledge graphs to an application-specific ontology, integrating datasets from various sources, gathering and transforming data for rendering in a GUI, extracting triples from literals using, for example, named entity recognition and much more.

RDF Dataset Enrichment Framework (DEER) v.2 Released
This release features an updated configuration vocabulary, shiny new prefixes provided by w3id.org, an improved version of DEER server, revamped analytics as JSON file output, an all new plugin type (DeerExecutionNodeWrapper), automatic configuration validation using SHACL and of course improvements to most of the existing enrichment operators.
Related posts:
 Graph Algorithms, Neural Networks, and Graph Databases. The Year of the Graph Newsletter Vol. 16, September 2019
 Graph Therapy. The Year of the Graph Newsletter Vol. 20, June / May 2020
 The evolution of the graph technology and business landscape in 2025. The Year of the Graph Newsletter Vol. 27, Spring – Summer 2025
 Graph-based data science, machine learning and AI. The Year of the Graph Newsletter Vol. 23, Spring 2021

