Towards a Knowledge Graph economy. The Year of the Graph Newsletter Vol. 21, Summer 2020

These past few months have not been kind to any of us. The ripples caused by the COVID-19 pandemic are felt far and wide, and the world’s economies have taken a staggering blow.
Is there hope? And what’s that got to do with graphs, you might ask.
Knowledge graphs have become an iconic technology trend for a reason. Knowledge graphs exemplify the emphasis on knowledge, and connections. In the current state of the economy, knowledge-based and remotely delivered activities have an advantage over service-based ones requiring real-world interaction.
Whether this is necessarily a good thing is another issue entirely. In any case, we have to note the fact that knowledge graphs seem a natural fit for the unofficial title of the foundation on which a next-day economy can be built.
That’s the thinking behind Connected Data London’s Meetup on September the 23rd. Steering towards a knowledge-based economy – how knowledge graphs can catalyze digital transformation and AI in the enterprise and beyond.
A UBS Information Architect will talk about a data revolution – the emergence of the decentralized Enterprise Knowledge Graph to vastly increase data connectivity. The CEO of Franz Inc will outline the future of AI in the Enterprise is tied to Entity-Event Knowledge Graphs for Data-Centric organizations. A Knowledge Engineer from Engine B will show how Knowledge Graphs can be used for Data integrity, innovation and digitalization in professional services.

Towards a knowledge-based economy: how Knowledge Graphs can catalyze digital transformation and AI in the enterprise and beyond
Digital transformation and AI may have become overworn buzzwords that mean very little. In essence, however, they’re more needed than ever for businesses that want to survive and thrive in a new economy. In this Connected Data London Meetup, we take a look at how Knowledge Graphs are redefining digital transformation and powering AI in the enterprise and beyond.
Case in point: Intuit is on a multi-year digital transformation journey to become an Expert Platform company, combining symbolic AI and machine learning. Its Tax Knowledge Engine allows domain experts to specify logic using Knowledge Graphs in a declarative and modular way
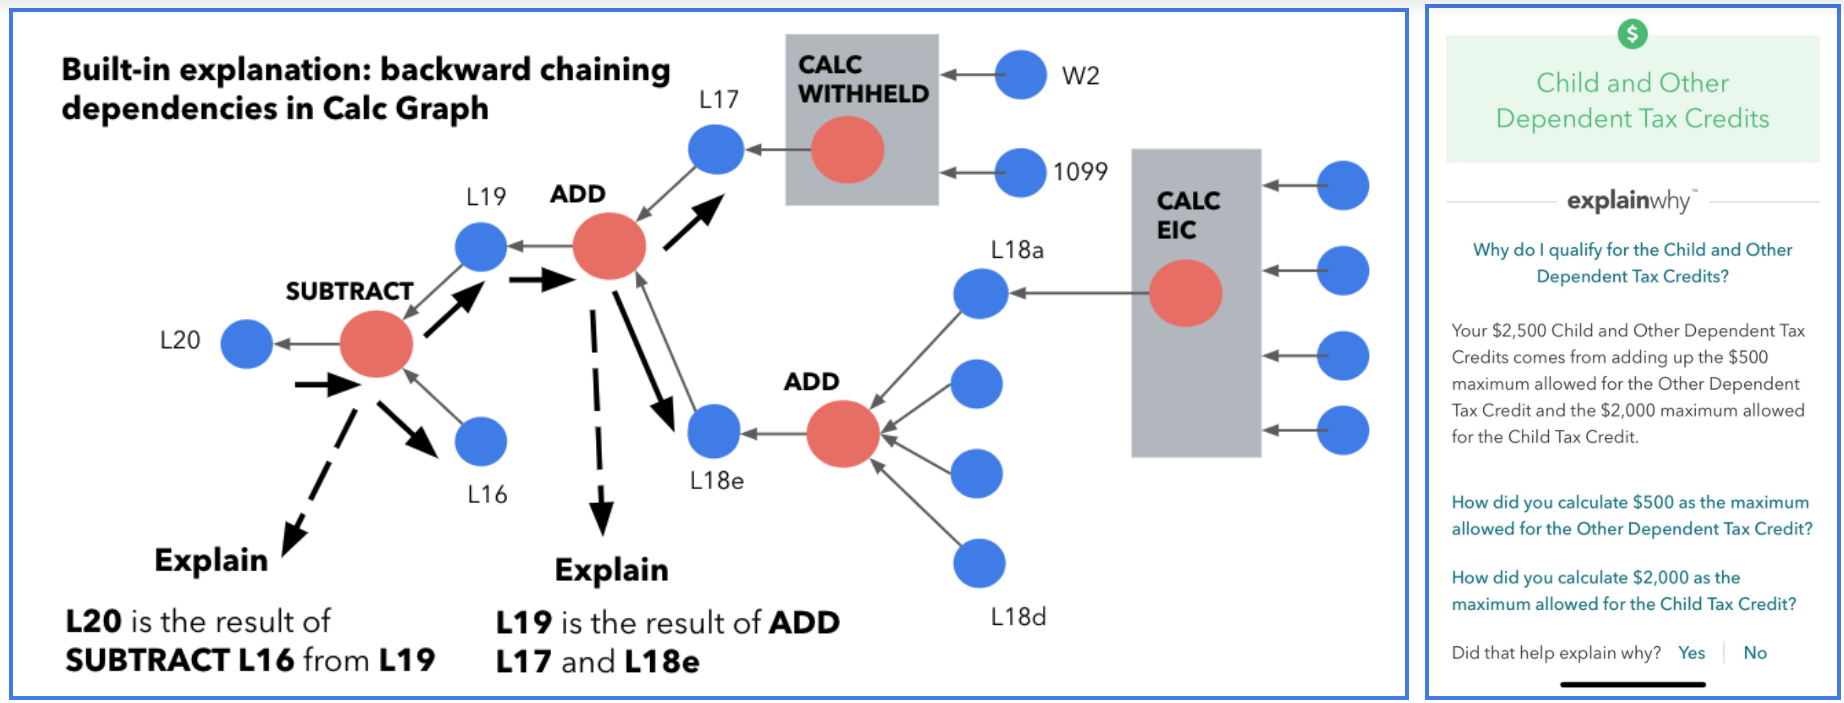
Intuit Tax Knowledge Engine: Practical AI for a Smarter and More Personalized TurboTax
We share a technical overview of Tax Knowledge Engine, the key innovation we’ve pioneered to make TurboTax smarter and more personalized for 37M+ consumers.
Beyond business, Knowledge Graphs have a role to play in organizations of all sizes and shapes. This includes the UN, championing Knowledge Graphs for Social Good. Furthermore, the Emerging Tech Lab (ETL) of the Office of Information and Communications Technology (OICT) has embarked on several projects that explore how to store knowledge in graphs.

Applying knowledge graphs for social good
You might wonder how a KG can reduce poverty or improve health. The answer is in the insights that Knowledge Graphs let us draw. Knowledge Graphs provide a means to understanding context, and that is the key to comprehending SDG data
The GOV.UK team explored graph databases and knowledge graphs for their applications. The goals were to collaborate with other teams and communities to help them find content more easily, to build products and apps that allow further insights about the content, to upskill colleagues and drive culture change to make better use of data, and to provide early adopters with access and training to help scale use of data apps and product.
One graph to rule them all
Initially, we experimented with representing user journey data in our graph and then added other, previously siloed, data sources. In the context of a graph, all metadata was added as node properties. At that point, we had the early makings of a knowledge graph; a rich, canonical source of data that brings together datasets from across GOV.UK and the wider world.
Another testatament to the importance and timeliness of Knowledge Graphs, Graph Databases, Graph Analytics and Graph AI: the Noonies nomination. The Noonies are Hacker Noon’s way of recognizing the tech industry’s top writers, thinkers, hodlers, leaders, and makers. George Anadiotis, the Year of the Graph Newsletter curator, has been nominated for Hacker Noon Contributor of the Year in Analytics.
Hacker Noon is built for technologists to read, write, and publish. It’s an open and international community of 12,000+ contributing writers publishing stories and expertise for 4,000,000+ curious and insightful monthly readers. This nomination comes as a recognition of the importance of the topics the Year of the Graph spreads knowledge on. If you want to show your support, cast your vote!
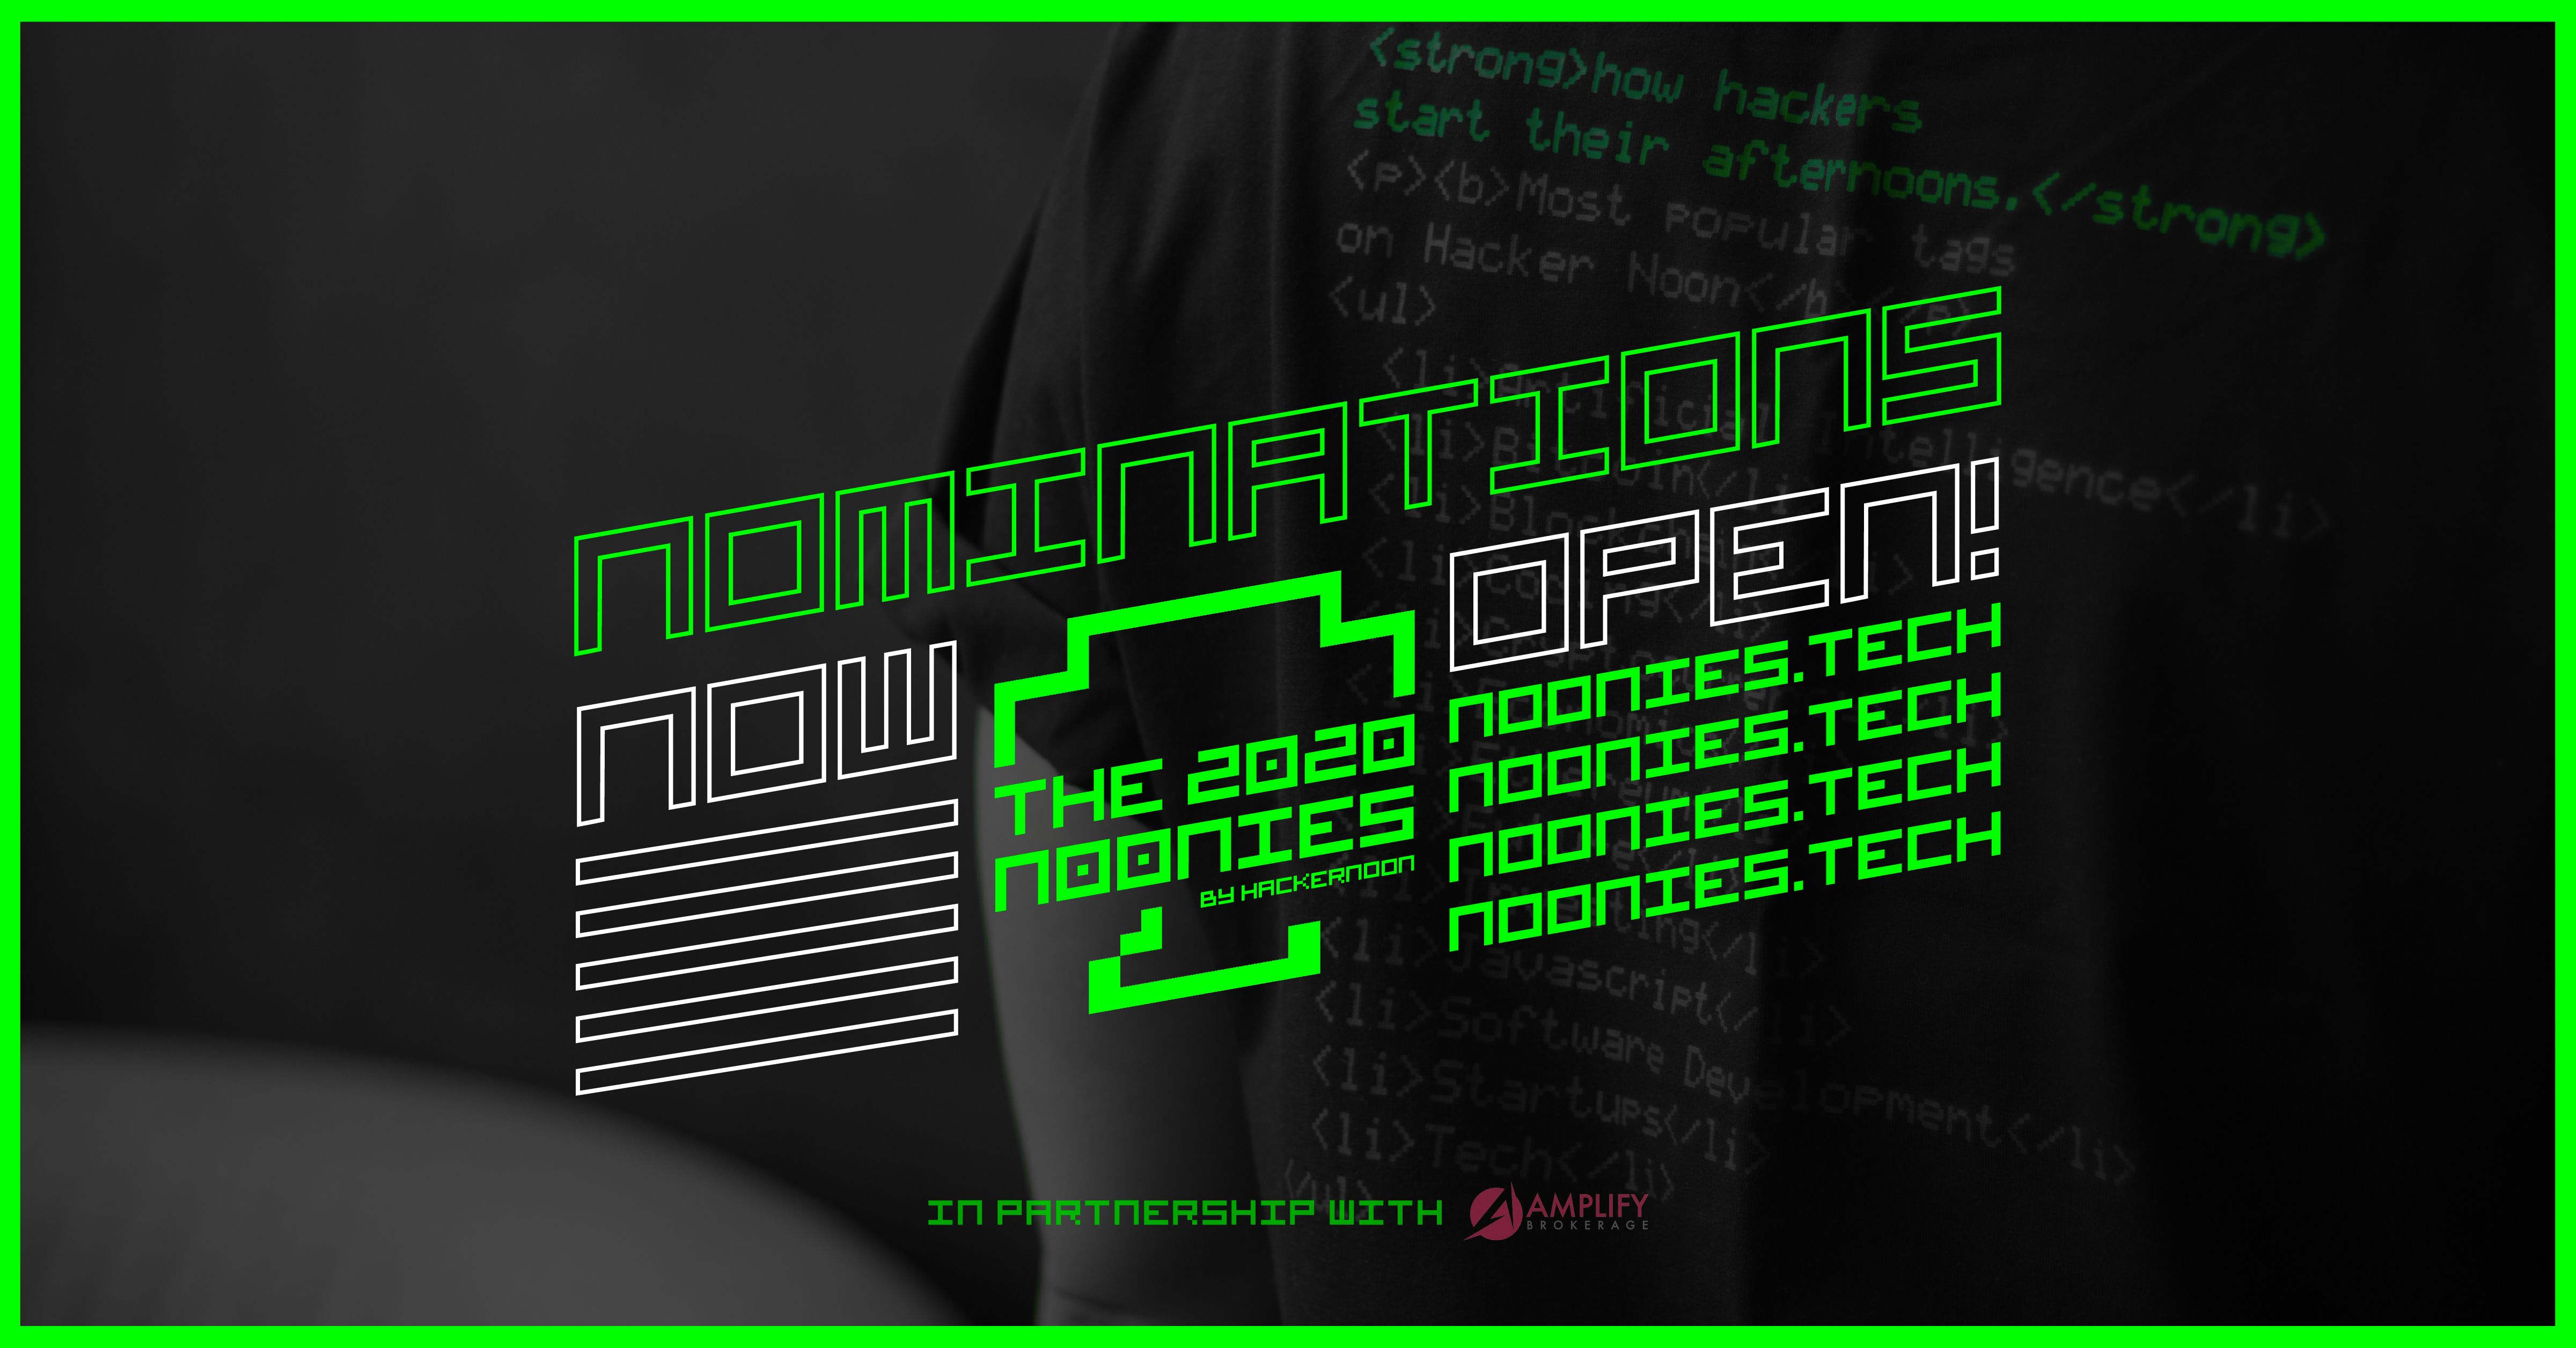
Hacker Noon Contributor of the Year – ANALYTICS
The Tech Industry’s Greenest Awards. The Noonies are Hacker Noon’s way of recognizing the tech industry’s top writers, thinkers, hodlers, leaders, and makers and you’ve been publicly nominated for: Hacker Noon Contributor of the Year – ANALYTICS
If you want to learn more about Knowledge Graph modeling, then these books may be what you need. The Semantic Web for the Working Ontologist, one of the most highly regarded books in this domain, just got a new release. Datasets and queries mentioned in the book are available online, too.
Ilaria Maresi encountered a range of challenges on her Knowledge Graph data modelling journey. If you are wondering what is a asemantic model and why you should consider building one, you can check her book, in which she shares lessons-learned/
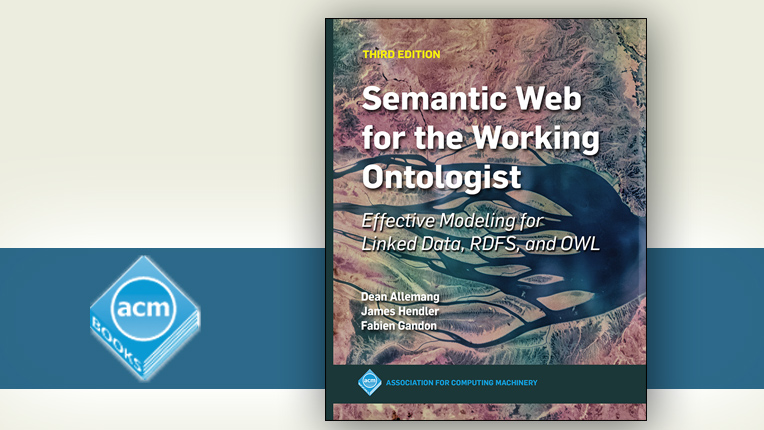
Semantic Web for the Working Ontologist, Third Edition
Fabien Gandon joins Dean Allemang and Jim Hendler, bringing with him years of experience in global linked data, to open up the story to a modern view of global linked data.
The most widely used Knowledge Graph schema is schema.org, which just had a new release – v.9. If you want to get started with schema.org, a little bit of history may help.
If you have already mastered that, then you may be interested in a way to get your brand in Google’s Knowledge Graph without a Wikipedia page, or in learning practical NLP while building a simple Knowledge Graph from scratch with Python.
Make sure you set out who you are and what you do clearly in the copywriting on your About Us page. Add Schema.org markup – make it as detailed as possible and cite sources that confirm. Get significant coverage in multiple independent, reliable, secondary sources.
Knowledge Graphs power the medical domain too. PubMed is an essential resource for the medical domain, but useful concepts are either difficult to extract or ambiguous. This hinders knowledge discovery. To address this, a PubMed Knowledge Graph was built.
Traditionally, Knowledge Graphs have been curated manually by experts, but machine learning can speed up the process. Here is a a review of advances in machine learning for constructing biomedical knowledge graphs.

Advances in machine learning for constructing biomedical knowledge graphs
By representing biomedical information as nodes, and the relationships between nodes as edges, KGs can be used to map out relationships between biomedical concepts to understand drug-target interactions or identify genes that play a role in disease progression.
Advancements in Natural Language Processing and Graph machine learning powered by Knowledge Graphs is something Michael Galkin has been keeping track of. Here he summarizes the latest research from ACL 2020. In a similar vein, Sergei Ivanov summarizes the highlights from KDD 2020, from a graph and recommender systems perspective.
Knowledge Graphs in Natural Language Processing @ ACL 2020
Did something change in the KG & NLP field comparing to ACL 2019? Yes! I would summarize this year’s contribution as: Knowledge graphs demonstrate better capabilities to reveal higher-order interdependencies in otherwise unstructured data
Michael Bronstein is a Professor at the Imperial College London and the Head of Graph Machine Learning at Twitter. He recently started a series on blog posts on Graph Machine Learning, on topics such as graph neural network architectures that can work on very large graphs, the issue of depth on graph neural networks, and temporal graph networks.
Temporal Graph Networks
Many real-world problems involving networks of transactions of various nature and social interactions and engagements are dynamic and can be modelled as graphs where nodes and edges appear over time. In this post, we describe Temporal Graph Network, a generic framework for deep learning on dynamic graphs.
Some notes on Graph theory. Centrality measures are an important tool to analyze networks. Analysis can be done with simple topological measures that score nodes by their importance as a part of the big network. Here is the definition and the tradeoffs involved. And to top it off: more graph theory, this time 10 graph algorithms, visually explained.
10 Graph Algorithms Visually Explained
Graphs have become a powerful means of modelling and capturing data in real-world scenarios such as social media networks, web pages, and locations. If you have a set of objects that are related to each other, then you can represent them using a graph.
Graph databases have been making progress. We have new releases from Dgraph and ArangoDB, the general availability of Neo4j on Google Cloud, and new visual capabilities for AWS Neptune by integrating Jupyter Notebooks.

Graph, machine learning, hype, and beyond: ArangoDB open source multi-model database releases version 3.7
A sui generis, multi-model open source database, designed from the ground up to be distributed. ArangoDB keeps up with the times and uses graph, and machine learning, as the entry points for its offering.
Analysis on data from different databases requires some kind of cross-walk or mapping. Mappings are a big deal for ontology too. Unfortunately mapping is fraught with problems. Here Chris Mungall introduces SSSOM: A Simple Shared Standard for Ontology Mapping

A simple standard for sharing mappings
Within the Open Bio Ontologies project we attempted to avoid the mapping issue by promoting reuse of ontologies and concepts from ontologies. However, not all ontologies are in OBO, and not all ontologies in OBO are perfectly modular and non-overlapping, so mapping remains a necessary evil.
Data ingestion typically comes before mapping. Here are a couple of simple but useful tools for data ingestion, enabling users to convert CSV to RDF, query RDF datasets & documents in arbitrary formats, and make diagrams from SPARQL queries.
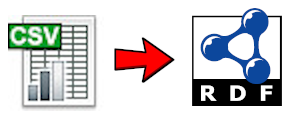
Converting CSV to RDF with Tarql
Quick and easy and, if you like, streaming. A year or two ago I learned about Tarql, which lets you query delimited files as if they were RDF triples.
Inrupt exists to drive a course-correction of the web, using the tools and principles embodied in Solid. Those tools and principles are very much based on W3C and Semantic Web standards, applying them to shape a new era, built on the web but encompassing much more. Inrupt just released new beta versions of its software.

Inrupt Beta Goes Live
Inrupt is pleased to announce that the following products are now available for Beta evaluation. Feedback received during this Beta period will influence the roadmap for General Availability. Enterprise Solid Server: designed for mission critical workloads, demanding use cases. PodBrowser: app enabling users to navigate/manage data in Pods. Javascript Developer Libraries
Lest we forget, we are still living in COVID-19 times. People are using Knowledge Graphs to consolidate medical knowledge: in addition to COVID Graph, Corona Why is another effort that leverages a Knowledge Graph.
Other researchers have created an automated process to retrieve COVID19 data from public sources, integrate them as RDF under a simple ontology built on top of OWL-Time, GeoSPARQL, SIOC, and link the resulting dataset to linked to data providers such as Wikidata. Another contribution: a knowledge base of 8M+ Covid-related tweets.

TweetsCOV19 — A Knowledge Base of Semantically Annotated Tweets about the COVID-19 Pandemic
A publicly available knowledge base of 8M+ tweets between Oct’19 – Apr’20. Metadata and entities, hashtags, user mentions, sentiments, URLs shared using RDF/S vocabularies, facilitating knowledge discovery tasks
What would reinventing email as a graph look like? The interface for email conversation traversal is usualy a linear column of timestamped message excerpts with nested replies inlined within message body. Ryan Bell created InboxGraph, a property graph representation for email

Constructing directed graphs of email conversations
The interface for email conversation traversal most often takes the form of a linear column of timestamped message excerpts with nested replies inlined within the message body. This is an excellent way to visualize the newest messages awaiting a response or action, but fails to illustrate the community structure and information flow within an inbox.
Related posts:
 Graph Therapy. The Year of the Graph Newsletter Vol. 20, June / May 2020
 Knowledge Graphs power scientific research and business use cases. The Year of the Graph Newsletter Vol. 19, April / March 2020
 The evolution of the graph technology and business landscape in 2025. The Year of the Graph Newsletter Vol. 27, Spring – Summer 2025
 Graph-based data science, machine learning and AI. The Year of the Graph Newsletter Vol. 23, Spring 2021

