Graph Algorithms, Neural Networks, and Graph Databases. The Year of the Graph Newsletter Vol. 16, September 2019

One of the world’s top AI venues shows that using graphs to enhance machine learning, and vice versa, is what many sophisticated organizations are doing today. New developments in graph algorithms and analytics, and the latest graph database releases, many of which incorporate graph algorithms and machine learning features.
Do you know KDD? SIGKDD’s Conference on Knowledge Discovery and Data Mining, as is its full name, is one of the most prominent venues for AI and data science. Alibaba, Amazon, Apple, Baidu, Snapchat are some of the organizations represented among the 3,5K people who were there. One thing they have in common: using Graph Neural Networks. About 20% of the 300+ papers involve graphs and knowledge-based systems.

Apple, Alibaba, Amazon, and the gang promote state of the art in AI and Knowledge Discovery with Graphs
As noted in Alibaba’s work, an increasing number of machine learning tasks require dealing with large graph datasets, which capture rich and complex relationships among potentially billions of elements. Graph Neural Networks (GNN) become an effective way to address the graph learning problem.
Graph-based machine learning, or GraphML, is still a relatively new area of interest. How does it fit into the world of analytics? Expero’s Graham Ganssle Graph notes that there are three paradigms of processing with respect to GraphML, which typify thousands of individual analysis types, and gives some use cases for each of these.

The three paradigms of GraphML
Graph analytics is a super hot area of research right now because we’re entering a world dominated by machine learning. There are many types of traditional graph analytics which don’t require machine learning. With respect to GraphML, there are three paradigms of processing which typify thousands of individual analysis types: Smart Data Extraction, Data Structure Analysis, Full Throttle GraphML.
Wu Huijun from StellarGraph uses graph convolutional networks to look behind the curtain. Saliency mapping is a technique with origins in computer vision literature used to change or simplify an image into something that has meaning for humans, making it easier to analyse. Huijun uses saliency maps in graph machine learning.

Saliency maps for graph machine learning
Using node classification with graph convolutional networks (GCN) as a case study, we’ll look at how to measure the importance of specific nodes and edges of a graph in the model’s predictions. This will involve exploring the use of saliency maps to look at whether the model’s prediction will change if we remove or add a certain edge, or change node features.
As noted when discussing GraphML, there are many types of traditional graph analytics which don’t require machine learning. Here are the 5 graph algorithms Data Scientists should know, because as per Walmart’s Rahul Agarwal, Graph Analytics is the future.
Data Scientists, 5 Graph Algorithms that you should know
In a connected world, users cannot be considered as independent entities. They have relationships, and we would sometimes like to include such relationships while building our machine learning models. In this post, I am going to be talking about some of the most important graph algorithms you should know and how to implement them using Python.
As graph analytics and algorithms are gaining steam, executing them fast and at scale becomes increasingly important. A new open-source library by NVIDIA could be the secret ingredient to advancing analytics and making graph databases faster. The key: parallel processing on NVIDIA GPUs. The effort is led by graph analytics veteran Brad Rees.

Nvidia Rapids cuGraph: Making graph analysis ubiquitous
With the release of version 0.9, NVIDIA cuGraph is coming one step closer to 1.0. As Rees explained, the goal is not just to keep adding algorithms to cuGraph, but to make them work over multiple GPUs, too. This has now been achieved for PageRank. Even in version 0.6, however, cuGraph was already up to 2000 times faster than NetworkX.
Would you like to catch up with Brad Rees, presenting an overview of RAPIDS and cuGraph, discussing and showing examples of how to manipulate and analyze graphs, and how data can be shared with machine learning algorithms?
Would you also like to join graph database experts George Anadiotis from ZDNet, Joshua Shinavier from Uber, Steven Sarsfield from Cambridge Semantics, and Geoffrey Horrell from Refinitiv discussing why, and how, graph databases will rule the world in the 2020?
For these, and countless others top of the line discussions and presentations, Connected Data London is the place to be. To celebrate the 15th issue of the Year of the Graph newsletter, use code CDL2019YOG15 for 15% discount, to see as many of you as possible there. And remember, with bulk and combo discounts in effect, you could save as much as 30%.
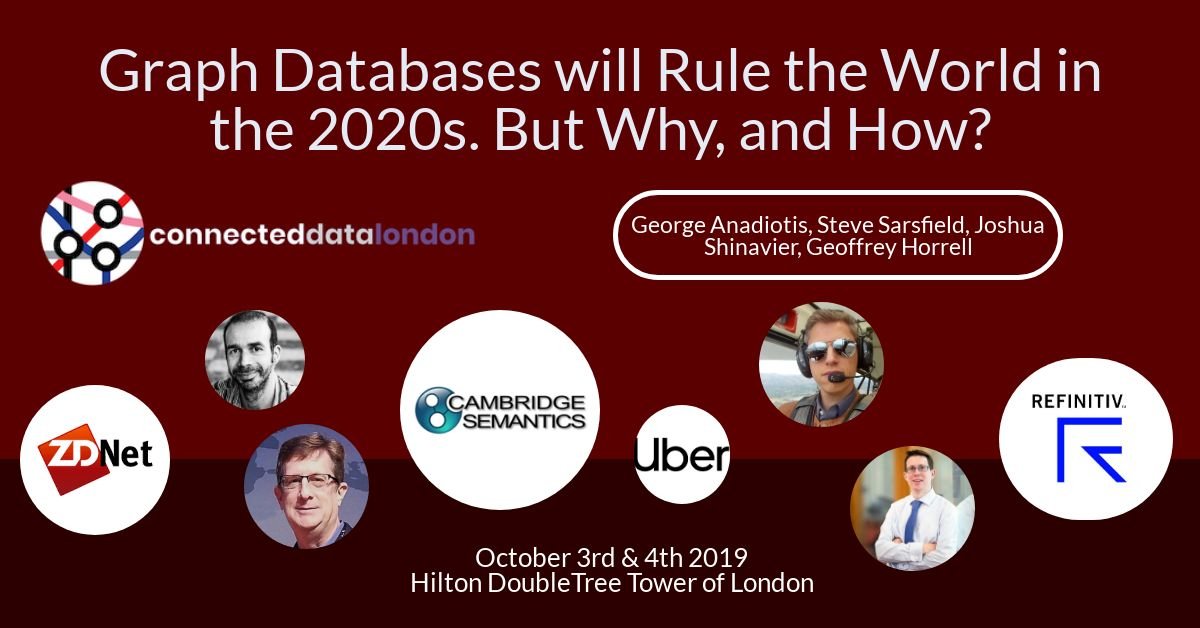
Graph Databases Will Rule the World in the 2020s. But Why, and How?
If you’re out to shop for a graph database, you will soon realize that there are no universally supported standards, performance evaluation is a dark art, and the vendor space seems to be expanding by the minute. So, what’s all the fuss about? What are some of the things graph databases are being used for, what are they good at, and what are they not so good at?
Dan McCreary from Optum goes through the Data Lake and Data Hub patterns, to emphasize what Knowledge Graphs can do for the enterprise. McCreary discusses how Graph Convolutional Neural Networks (GCNs) leverage graph structure to find deep insights even with small training sets. He also touches upon advances in hardware, and how they are related to this.

From Lakes to Hubs to Graph
We need to build a community of AI researchers educated in what graph algorithms can do at scale & how deep learning algorithms can reinforce graph algorithms to build advanced HTAP solutions. We need to make hardware vendors understand the needs of the scaleable graph algorithm community. We need support for high-level declarative graph languages that perform queries over distributed native graph databases.
Denise Gosnell from DataStax spent time talking to dozens of graph users from around the world. Across those conversations, she notes, there has been one common theme: Engineering teams use graph technology because it makes them more productive due to: 1) Easier code maintenance. 2) Ease of human understanding. 3) Graph data helps come up with new features for predictive models.

Graph technology makes teams more productive
At some point, a researcher isn’t going to be able to improve the accuracy level of their model any further. By augmenting their feature sets with graph features, like path distance, teams were able to unlock new gains in their model’s accuracy. Machine learning teams model and extract graph features to enhance the accuracy of their predictive models.
Exploring how the Google Knowledge Graph works can provide some insights into how is growing and improving and may influence what we see on the web, writes Bill Slawski from SEO by the Sea. Slawski writes about a newly granted Google patent from the end of July, which tells us about one way that Google is using to improve the amount of data that the Google Knowledge Graph contains.

Google knowledge graph reconciliation
Reconciling entities means “providing computers with unambiguous identifications of the entities we talk about.” This patent from Google focuses upon a broader use of the word “Reconciliation” and how it applies to knowledge graphs, to make sure that those take advantage of all of the information from web sources that may be entered into those about entities.
We recently saw how Pinterest introduced Knowledge Graphs in its stack to enhance its existing taxonomies. Pinterest engineers elaborate on the Pin2Interest system for content classification and their Adventures in big data wonderland Going down the Pinterest Path.
Adventures in big data wonderland going down the Pinterest path
Pinterest is a discovery engine that connects ideas across a taste graph, so for every Pin on Pinterest, there are Related Pins (Pins that are visually and semantically similar to that Pin), which we are always working to keep fresh. When thinking about how to visualize and construct these complex Pinterest Paths, it can be useful to think of a Pinterest Path as a graph.
Taxonomy is easy, says Bob Kasenchak from Synaptica. That’s a good opener, which lets Kasenchak show some of the issues with building taxonomies (and by extension, hierarchical data models) which emphasize the need for knowledge graphs.

Naming the Edges, or: Why Knowledge Graphs?
And so we come to the reason we’re hearing about the “rise of knowledge graphs” in recent books and articles and at conferences: it’s solving a problem in vocabulary architecture that’s becoming increasingly important as the foundation of AI and other technologies (not to mention search).
Another data modeler, Thomas Frisendal, another look at how graphs can facilitate data modeling. Frisendal goes on a quest for defining (parts of) the future history of temporal data modeling, starting with SQL, including the OWL ontological data model, and property graphs.
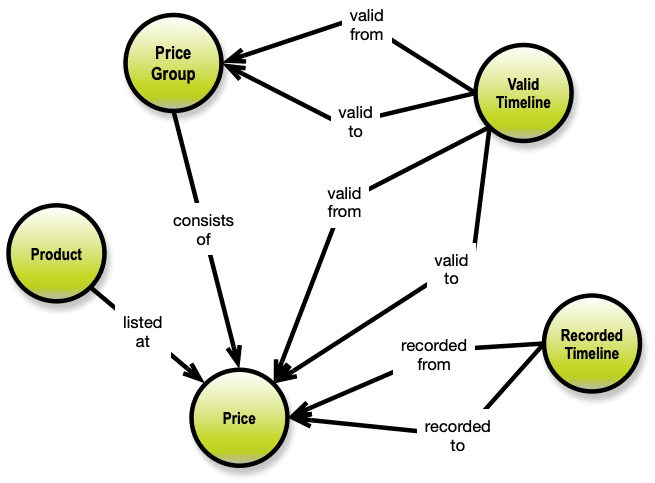
The future history of time in data models
Temporal dependencies quickly explode into a highly connected network, which best can be handled by a graph DBMS. Complexity must be hidden for both data modelers and business users by way of some higher-level concepts. I wrote this post to provoke vendors into considering this architectural sketch for their future product development.
SHACL is a W3C standard to validate RDF, which many people find more usable than the rather heavyweight OWL. Here Emidio Stani shows how to design reusable SHACL shapes and implement a linked data validation pipeline.
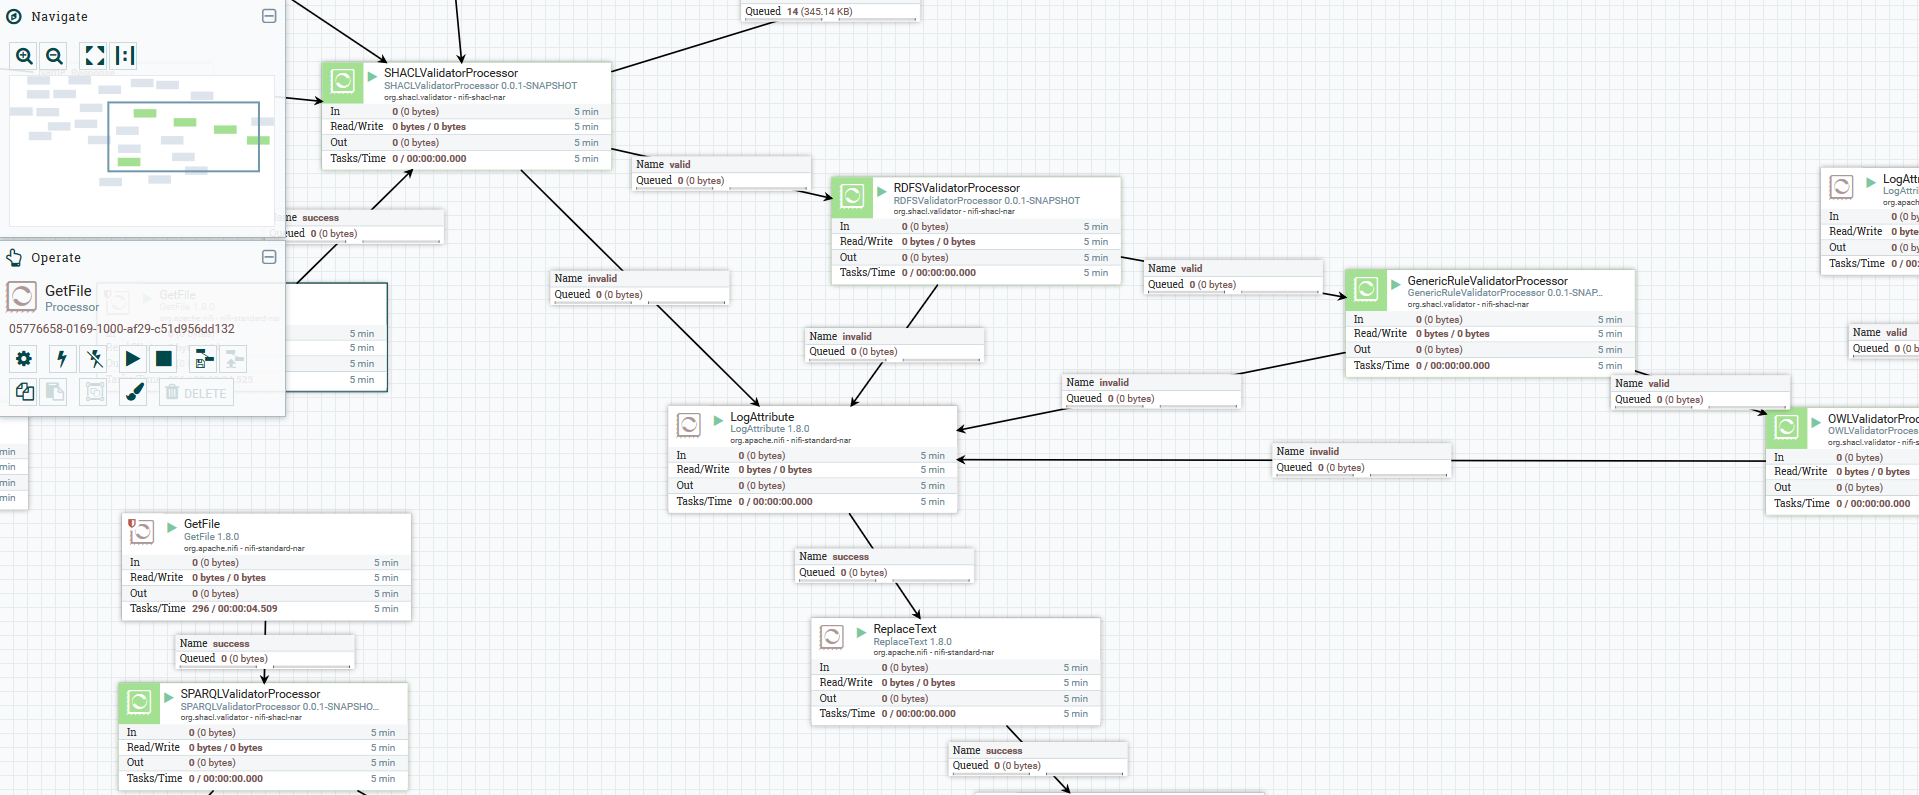
Design reusable SHACL shapes and implement a linked data validation pipeline
In July 2017, W3C published SHACL as the standard to validate RDF. Since then, data modellers have the possibility to provide validation services based on SHACL shapes together with their models, however there are considerations to be taken in account when creating them.
If you are a Neo4j user, and want to able to import / export RDF data, Jesus Barrasa from Neo4j has just released a new version of his NeoSemantix plugin. Importing RDF into Neo4j, serializing your Neo4j graph as RDF (JSON-LD, Turtle, N-Triples, etc), Quads/Named graphs, Mappings, Microinferences, more new features and a user manual.
NEOSEMANTIX
NSMNTX is a plugin that enables the use of RDF in Neo4j. RDF is a W3C standard model for data interchange. This effectively means that NSMNTX makes it possible to Store RDF data in Neo4j in a lossless manner, on-demand export property graph data from Neo4j as RDF. Other features in NSMNTX include model mapping and inferencing on Neo4j graphs.
There’s been a few graph database releases in the last month. Before we get to those, however, a new release for Apache Tinkerpop – 3.4.1. TinkerPop is a graph processing framework which includes Gremlin, a widely supported graph query language. Kelvin Lawrence from AWS notes that Amazon Neptune now supports TinkerPop 3.4, and explains how to use the new features in Neptune.

Amazon Neptune now supports Tinkerpop 3.4 features
Examples of new features in the Gremlin query and traversal language such as text predicates, changes to valueMap, nested repeat steps, named repeat steps, non-numerical comparisons, and changes to the order step. It is worth pointing out that TinkerPop 3.4 has a few important differences from TinkerPop 3.3. Be sure to review the compatibility notes in the engine releases documentation.
After raising Series A funding and reaching 10K stars on Github, open source graph database Dgraph releases v.1.1 . New features: new type system, upsert blocks, binary backups, access control lists. Plus performance & bug fixes, and a few breaking changes.
Releasing Dgraph v1.1.0
Dgraph’s new release v1.1.0 is here. The new version ships with a plethora of significant changes and new features. In this post, we will cover the most important ones, but you can find all the details in the changelog.
Multi-model, open source database with support for graph ArangoDB released version 3.5 released. New features include distributed joins, streaming transactions, extended graph & search capabilities.

Multi-model database ArangoDB 3.5 released
The new k-shortest path feature provides the option to query for all shortest paths between two given vertices, returning sorted results based on path length or path weight. Imagine you transferred a transportation network to a graph dataset and now navigate between two given points. You can query for shortest travel distance, shortest travel time, or any other information you have stored on edges.
Wrapping up with graph database updates, a benchmark and its rebuttal. TigerGraph released a benchmark comparing its product against Neo4j. Max DeMarzi from Neo4j had some objections to the methodology and the results published. As we always say, benchmarks are a nuanced topic, on which you can hardly ever expect competing vendors to agree – you have to do your own research.
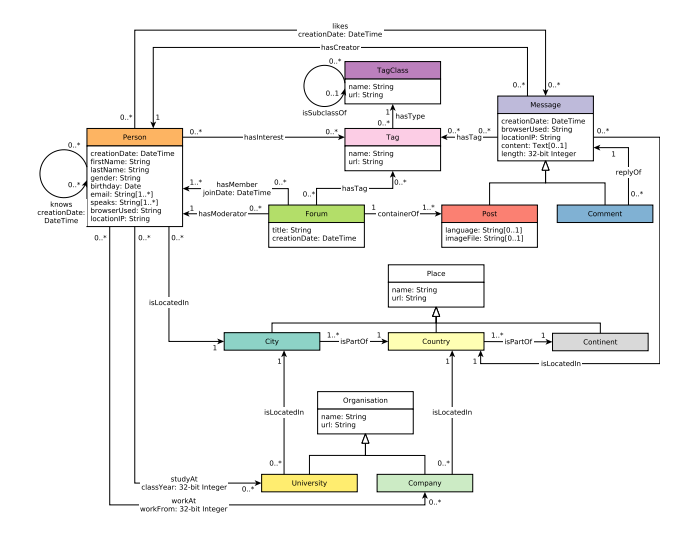
In-Depth Benchmarking of Graph Database Systems with the Linked Data Benchmark Council (LDBC) Social Network Benchmark (SNB)
In this study, we present the first results of a complete implementation of the LDBC SNB benchmark — interactive short, interactive complex, and business intelligence — in two native graph database systems — Neo4j and TigerGraph.
Siren is not a a graph database, but its claim to fame is making your existing data look like a knowledge graph, without actually being in a graph database. Siren released v.10.3, with what it calls five new AI superpowers.
Siren 10.3 is out with five new AI superpowers
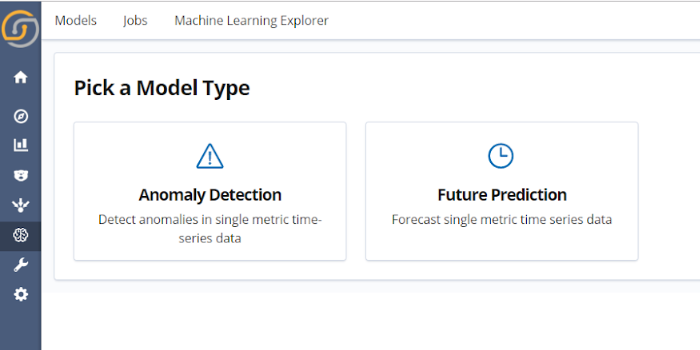
Deep learning-based predictive analytics and alerting (Siren ML). Deep learning-based time series anomaly detection. Unstructured data discovery with real-time topic clustering. Associative in-dashboard Relational Technology (“Dashboard 360”). State-of-the-art, self-correcting entity resolution (Siren ER).
Related posts:
 Knowledge Graphs and Natural Language Processing. The Year of the Graph Newsletter Vol. 15, July/August 2019
 The evolution of the graph technology and business landscape in 2025. The Year of the Graph Newsletter Vol. 27, Spring – Summer 2025
 Graph-based data science, machine learning and AI. The Year of the Graph Newsletter Vol. 23, Spring 2021
 Return of the Graph: Geospatial Knowledge Graphs, Personal Knowledge Graphs, and Evolution. The Year of the Graph Newsletter Vol. 24, Spring 2023

