Knowledge Graphs are the new Black. The Year of the Graph Newsletter Vol. 13, May 2019

Knowledge graphs become a centerpiece of Accenture and Microsoft’s toolkits. Knowledge graph lessons from Google, Facebook, eBay, IBM. Graph algorithms and analytics by Neo4j and Nvidia. Connected Data London and JSON-LD goodness, tips and tools for building and visualizing knowledge graphs, using graphs with Elixir and Typescript, and Geometric Deep Learning for a 3D world, using graphs.
Knowledge Graphs are the new Black, says Jean-Luc Chatelain, Accenture Managing Director – CTO Applied Intelligence (AI). Chatelain presented Accenture’s take on Knowledge Graphs at Strata London 2019. You’d think it does not get much more mainstream than this.

Using Knowledge Graphs to manage AI at scale
Knowledge Graphs are the new Black! Even more important, they are a fundamental building block of a data driven enterprise powered by #appliedintelligence. NLP & Content Analytics techniques are key to hydrate a KG, enrich it and truly unleash its power. Attached is a introduction to KG that my esteemed colleague Teresa Tung and I presented at Strata London 2019.
And yet, it does more mainstream. Graph was also a centerpiece in Microsoft’s Build event. In terms of strategy, Microsoft now emphasizes its Knowledge Graph, and sends the message that it’s a key part of its back-end, as noted by Tony Baer on ZDNet.
In terms of product announcements, Azure Cosmos DB, Microsoft’s multi-model database with support for graph, now has full Spark API support too. This is an important addition for Cosmos DB, largely expanding its analytics capabilities, launching it into the HTAP (Hybrid Analytics Transactional Processing) category

It was hard to top last year’s demonstration of the new Microsoft 365 experienced powered by the Microsoft Graph. The focus this year shifted to how the graph could break down application and device silos to make everyday applications more user-centric.
It’s not just talk, apparently. In this writeup based on an ISWC 2018 session moderated by Google’s Natasha Noy, including knowledge graphs experts from Microsoft, Facebook, eBay, and IBM, Microsoft seems to be #2 in knowledge graph size after Google.
Those graphs come in different sizes and shapes, and are used for different purposes. It’s interesting to compare Google’s and Microsoft’s graphs, as they are both used to support search and answering questions in search and during conversations. Microsoft’s graph has more entities (2 billion compared to Google’s 1 billion), but less connections (55 billion vs. 70 billion).
That’s something to keep in mind when comparing Google and Bing results, for example: connections matter. But that’s not the only takeaway from this. Seeing how graphs at such scale deal with the key requirements of coverage, correctness, structure, and freshness, has a lot to teach.

Industry-scale Knowledge Graphs: Lessons and Challenges. Five diverse technology companies show how it’s done
Knowledge graphs are critical to many enterprises today: They provide the structured data and factual knowledge that drive many products and make them more intelligent and “magical.”.
Wrapping up the graphs at scale theme, Uber’s Joshua Shinavier talked about graph best practices and lessons learned at a recent NYC Knowledge Graph event.

Uber’s graph expert bears the scars of billions of trips
One of Uber’s experts in building knowledge graphs, Joshua Shinavier advises fellow data scientists that “real data is messy, but the fact is, if you want to build an enterprise knowledge graph, you have to deal with it.”
A key reason why graphs are seeing such adoption is the ability to use graph algorithms for analytics. Mark Needham & Amy E. Hodler from Neo4j have just published a free O’Reilly book on graph algorithms, with practical examples in Apache Spark & Neo4j.

Free O’Reilly Book: Graph Algorithms in Apache Spark and Neo4j
We’re thrilled to announce the availability of the O’Reilly book Graph Algorithms: Practical Examples in Apache Spark & Neo4j – a practical guide to help you get the most out of graph analytics.
How about running graph algorithms on GPUs? Nvidia has released a new version of its cuGraph open source framework, which lets you do just that, and announced a partnership with some top research institutions to develop its graph arsenal further.
Want to learn more about this from Nvidia’s involvement in graph? Brad Rees, Nvidia Manager | AI Infrastructrue Manager leading the cuGraph effort will be speaking at Connected Data London.

RAPIDS cuGraph
RAPIDS cuGraph is a library of graph algorithms that seamlessly integrates into the RAPIDS data science ecosystem and allows the data scientist to easily call graph algorithms using data stored in a GPU DataFrame.
With knowledge graphs being in such high demand, we can expect a lot of people to be looking for a head start: definitions, tips, and how to go about building knowledge graphs. Semantic Arts offers definitions, Kurt Cagle discusses the Borrow, Build or Buy dilemma for ontologies
Claudio Nichelle does a writeup built around the drawings from his first experience with Linked Data, and how he shared them as Linked Data. Last but not least, DataStax’s Dave Bechberger presents an Intro to Graph Databases for Data Scientists
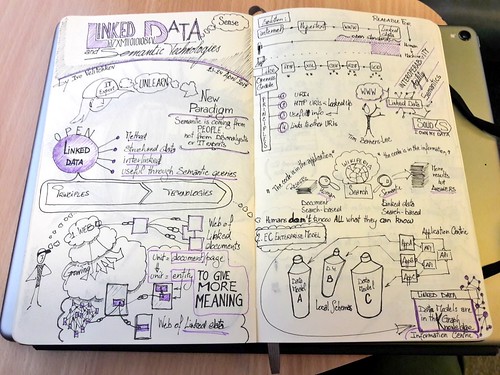
Linked Data, Semantic web, sketchnotes and online collaboration
Recently I had the privilege of attending a course on Linked Data and Semantic technologies. I took the challenge and added my images on the platform. I also had fun to enrich them with meta-data, RDF triples and annotations. This was a great exercise after the course where I put into practice what I had learned.
That’s all fine and well, but there’s nothing like learning from the experts in real life. We just announced the first workshop sessions in Connected Data London on October the 3rd, with leading practitioners showing how it’s done. Workshops will provide foundational as well as hands-on, transferable knowledge, based on open source and/or free tools.

Connected Data workshops: get hands-on knowledge, learn from the best
When we announced Connected Data London 2019, we wanted our first ever workshops to be a center piece of our offering. Today we are happy to unveil our program and instructors. We picked some of the most sought after topics, and some of the most knowledgeable people to show how it’s done.
Speaking of semantic SEO, Jono Alderson’s specification for integrating structured data, with an overview of the core principles behind Yoast’s approach to constructing scalable, interoperable schema.org markup, has been released.
The document provides guidelines for how plugin vendors, theme developers and third parties can extend Jono’s approach to ensure that they output (or contribute to) a cohesive, unified knowledge graph, and how they can integrate with the Yoast SEO plugin – which just released a new version. To learn more, come see Jono Alderson in Connected Data London.

A specification for integrating structured data
This document provides an overview of the core principles behind our approach to constructing scalable, interoperable schema.org markup.
More JSON-LD, this time from Bob DuCharme. DuCharme notes that the amount of JSON-LD data out there is exploding, and we can query it with SPARQL, so it offers many new possibilities for RDF-based applications. DuCharme shows how to do this, while in a subsequent post, he goes on to show how to convert JSON-LD schema.org RDF to other vocabularies.
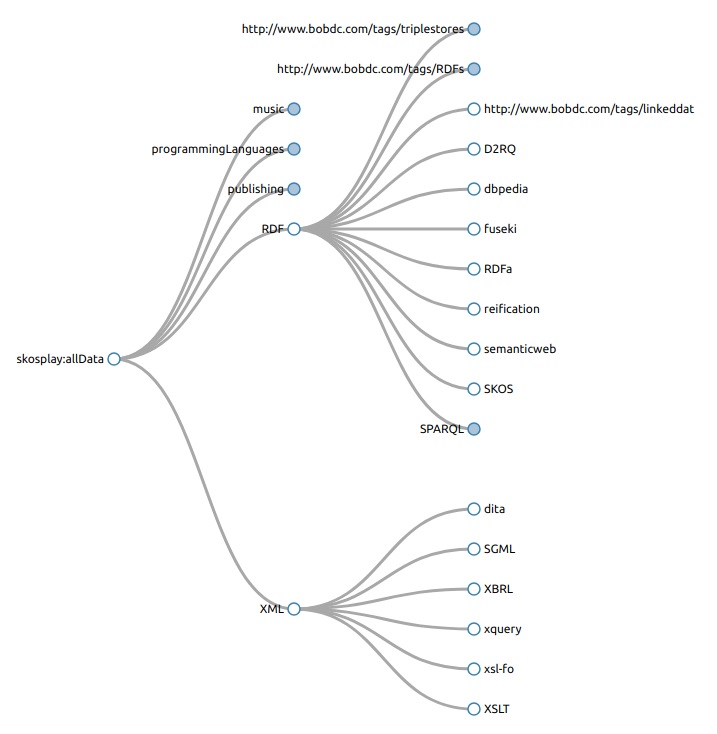
Converting JSON-LD schema.org RDF to other vocabularies
Some people fret about the “one schema to rule them all” approach. I don’t worry so much because one of the great things about RDF is that once you’ve got data in any standardized RDF syntax, you can convert it to use whatever namespaces you want.

Modeling Schema.org Schema with TypeScript: The Power and Limitations of the TypeScript Type System
Recently, I published schema-dts, an open source library that models JSON-LD Schema.org in TypeScript. A big reason I wanted to do this project is because I knew some TypeScript type system features, such as discriminated type unions, powerful type inference, nullability checking, and type intersections, present an opportunity to both model what Schema.org-conformant JSON-LD looks like, while also providing ergonomic completions to the developer.
If Elixir is your thing, Tony Hammond has been working with RDF & LPG graphs using Elixir, and he goes on to show how to do conversions from one graph form to another in Elixir.

Graph to graph with Elixir
In earlier posts I’ve shown how to access and manipulate RDF graphs using Elixir and separately also how to access and manipulate labeled property graphs (or LPG graphs). What I’d like to focus on here is conversions from one graph form to another in Elixir.
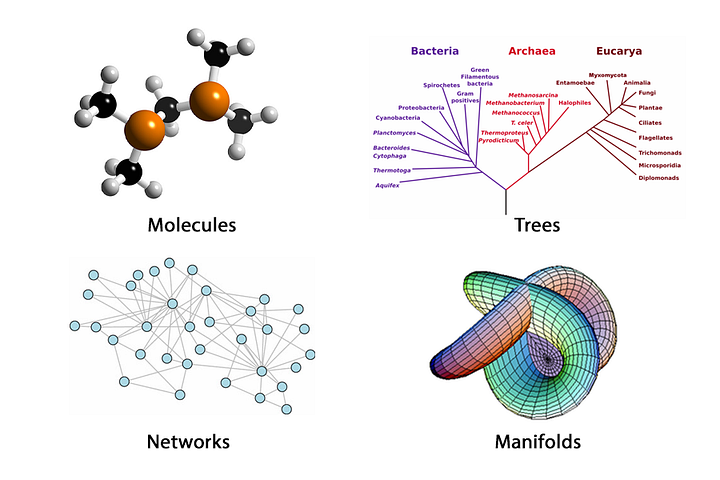
An expert knowledge graph builder, Chris Mungall, discusses what is considered a good practice in the community: restricting ontologies to single inheritance.

OntoTip: Single-inheritance principle considered dangerous
The idea of classification using tree structures can be traced to the 3rd century CE and the Greek philosopher Porphyry’s Trees depicting Aristotle’s categories. The tree has enjoyed a special status despite the realization that nature can be classified along multiple axes, leading to polyhierarchies or Directed Acyclic Graphs (DAGs).
How about visualizing knowledge graphs? There’s a slew of options for this, and many of those have released updates: Cambridge Intelligence launched ReGraph for React developers, Linkurious enterprise 2.7 automates investigation workflows, and yFiles for HTML brings improvements in layout, view and interaction.
In terms of visual tools for building knowledge graphs, Gra.fo has updates in exports, mapping, and documentation, while Stardog Studio has added visual capabilities too.
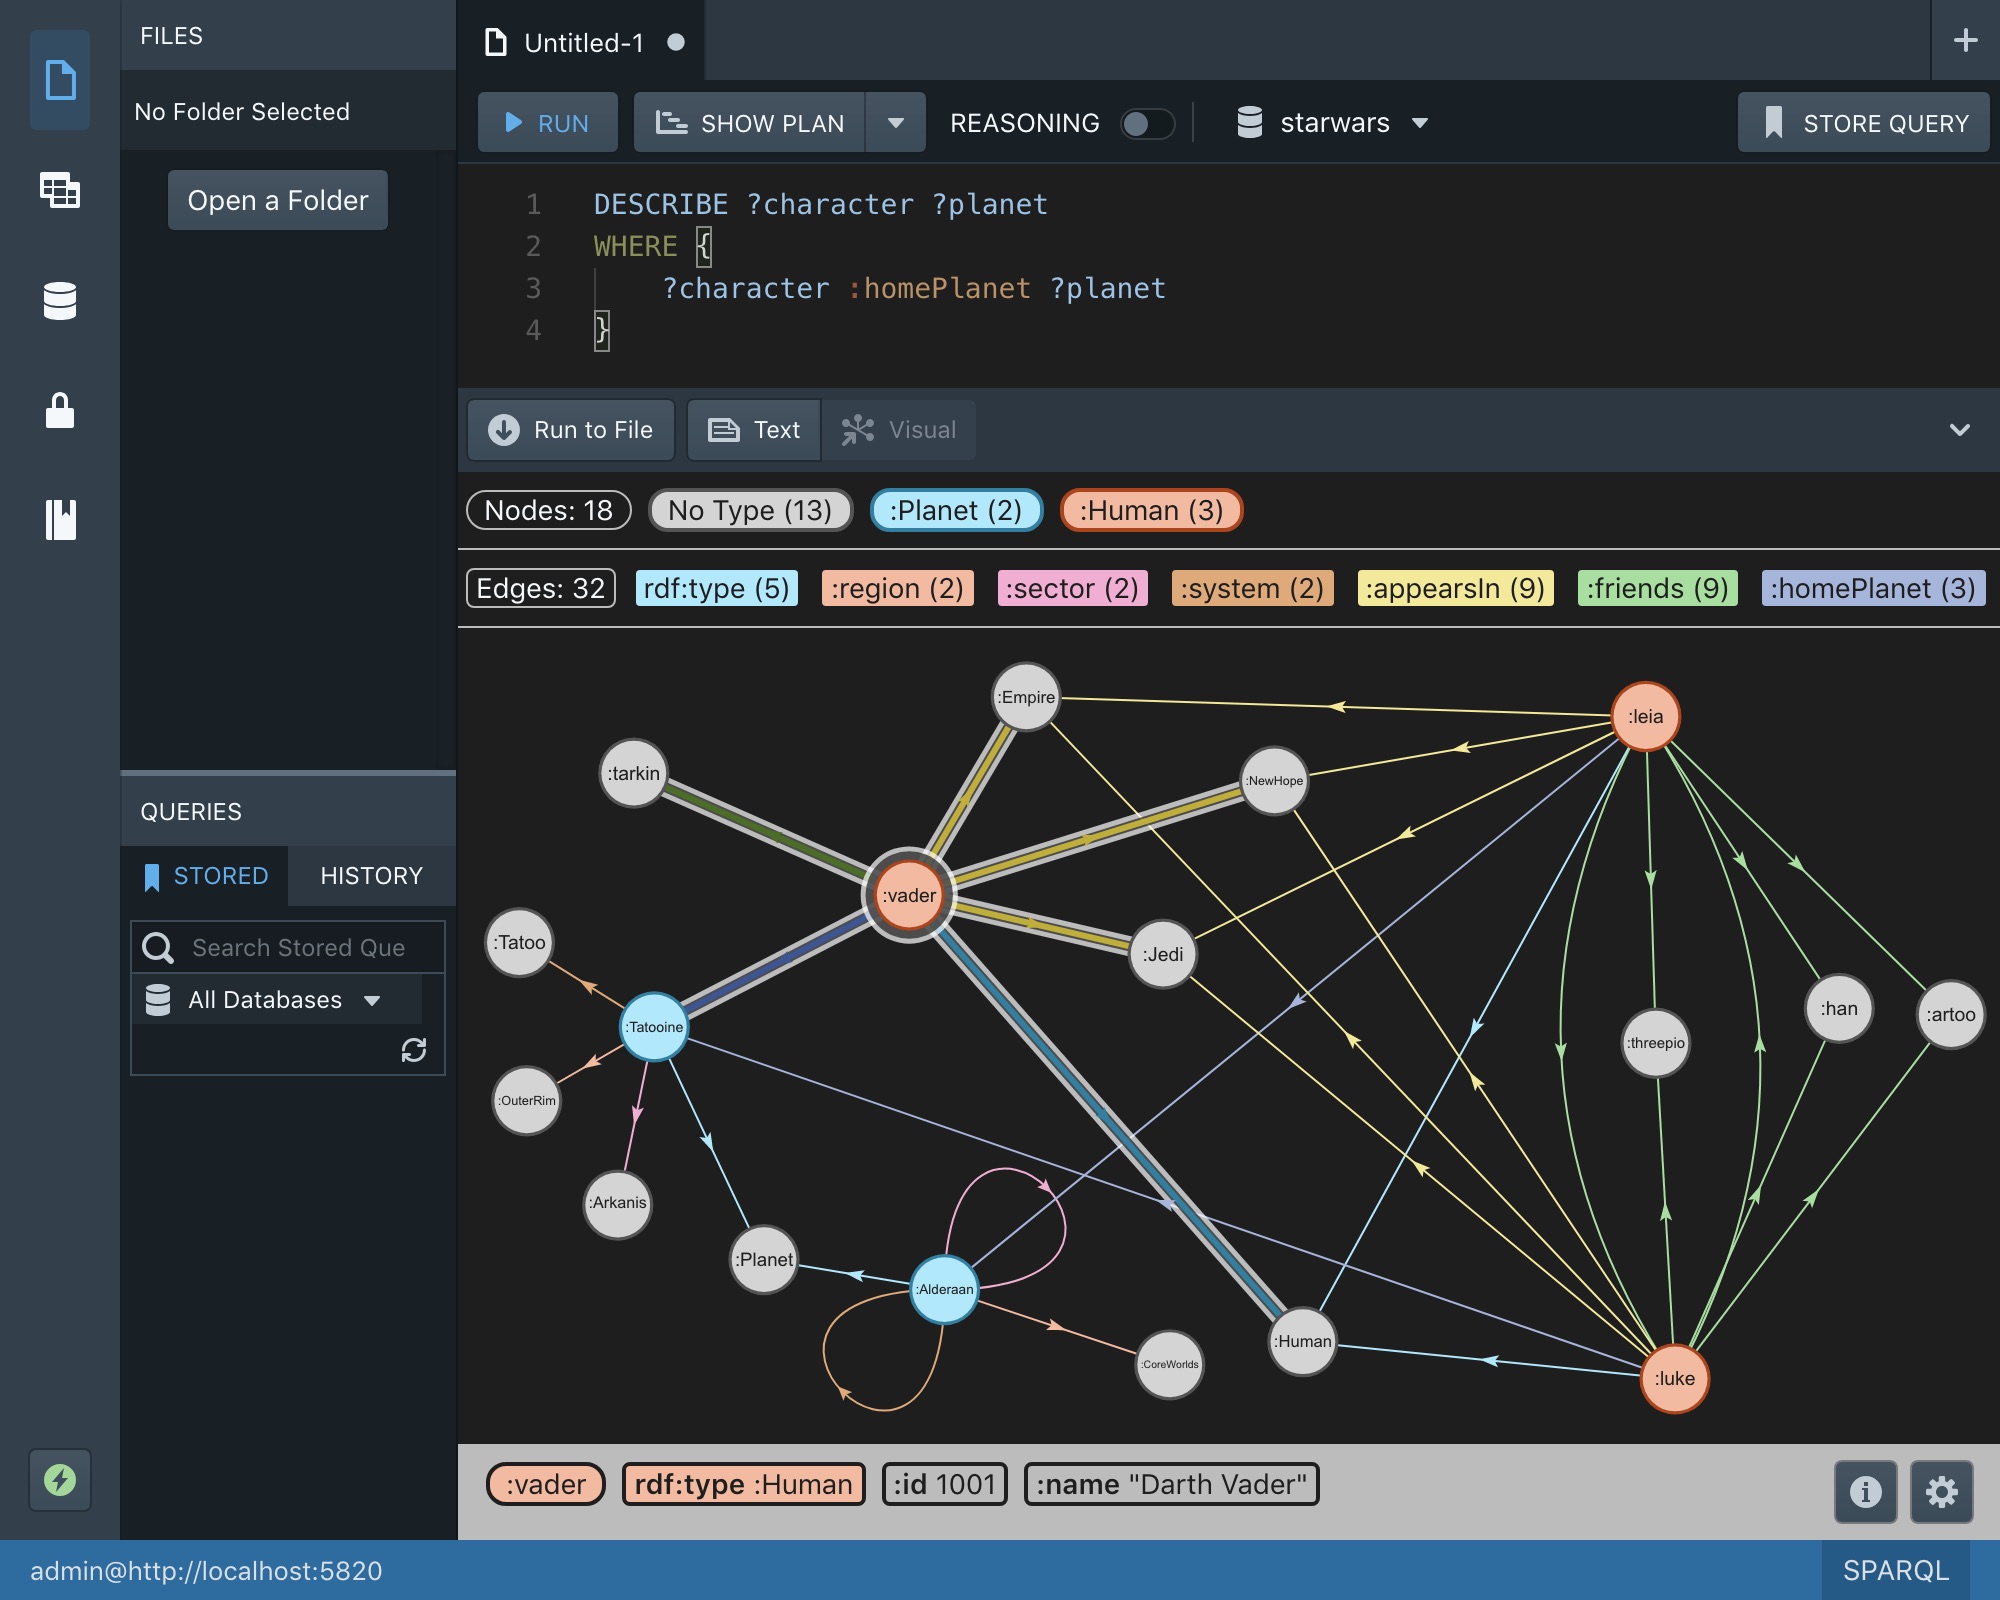
Picture this: visual results in Studio
Data visualization has been a highly requested feature for Stardog, so we’re happy to announce that we’ve built Visual Results into Stardog Studio. With support for both CONSTRUCT and DESCRIBE query results, you can quickly see and customize a visual representation of your graph to browse and explore your data.
What is Geometric Deep Learning? And what does it have to do with graphs? Flawnson Tong argues that bringing machine learning to our level can be done by building neural networks that can learn from non-euclidean data, and the prime example of a non-euclidean datatype is a graph.
This abstract data structure can be used to model almost anything. We want to be able to learn from graphs because graphs allow us to represent individual features, while also providing information regarding relationships and structure.
What is Geometric Deep Learning?
The vast majority of deep learning is performed on Euclidean data. This includes datatypes in the 1-dimensional and 2-dimensional domain. But we don’t exist in a 1D or 2D world. All that we can observe exists in 3D, and our data should reflect that. It’s about time machine learning gets to our level.
Related posts:
 A gravitational wave moment for graph. The Year of the Graph Newsletter Vol. 11, March 2019
 Knowledge Graphs and Natural Language Processing. The Year of the Graph Newsletter Vol. 15, July/August 2019
 Graphs in the cloud. The Year of the Graph Newsletter Vol. 12, April 2019
 Graph explosion and consolidation. The Year of the Graph Newsletter Vol. 14, June 2019

