New releases, algorithms, and visualization. The Year of the Graph Newsletter Vol. 2, May 2018

It has been an interesting month in the graph database world.
We saw 2 minor and one major graph database versions come out, namely GraphDB 8.5, Neo4j 3.4 and DSE Graph 6.0. Each of these brings interesting new features and reshapes the landscape a little bit.
We saw more graphs hit the mainstream: explaining index-free adjacency to managers, discussing graph queries, algorithms and analytics on Forbes, and looking under Amazon Neptune’s hood on ZDNet.
We saw graphs being used for Master Data Management, as well as Deep Learning. We also saw a new way to write SPARQL queries using JSON, and a free web-based tool to visualize ontologies.
DSE (DataStax Enterprise) is Cassandra’s commercial version. People don’t think of Cassandra as a graph database, and that’s because it isn’t one. But DSE is a different story. DSE has been adding Graph features to its arsenal since 2015, and by now can be considered a multi-model database, including Graph. As DSE 6.0 was just released, we take a look at what’s new, focusing on Graph.

DataStax Enterprise Graph 6.0: what’s new, and what’s coming?
DataStax Enterprise just released version 6.0, a major upgrade. We take an insider tour with Jonathan Lacefield, Senior Director of Product Management with DataStax, focusing on DSE Graph.
Neo4j has a new release too. Neo4j 3.4 will be GA in mid-May, and it introduces a number of improvements in performance and management. What is most notable, and promoted, about it however is Bloom. Bloom is a new visualization tool that complements the existing Neo4j browser, as it is addressed at non-technical users. This was a gap in Neo4j until now, and perhaps cause for concern for stand-alone graph visualization solutions.
Last but not least in the new releases, GraphDB 8.5. More efficient data synchronization, better reporting, and a preload tool are all welcome additions. But what is the most notable new feature is the improvements to the RDFRank plugin. RDFRank is an out-of-the-box algorithm that makes PageRank-like calculations easier. Now RDFRank can work asynchronously and use filters.

Ontotext’s New GraphDB 8.5
Ontotext is proud to announce the release of GraphDB 8.5 – the latest version of its semantic graph database that is even more efficient and faster in loading, processing and updating vast amounts of data.
But really, what is the difference between Graph Queries, Graph Algorithms And Graph Analytics? Dan Woods discusses, on Forbes, of all places.

Improve Your Graph IQ: What Are Graph Queries, Graph Algorithms And Graph Analytics?
I’ve been studying graphs for a while and although it’s always been interesting to hear people talk about graph analytics, it has never been clear to me precisely what is meant.
And since we’re in a discussion / education mode here, do you know what index-free adjacency is? If you’re interested in Graph Databases, you should. Dan McCreary explains this in an approachable way.

How to Explain Index-free Adjacency to Your Manager
Index-free adjacency is the most important concept we need to understand when learning about native graph databases. Native graphs have very different use-cases than non-native graph databases.
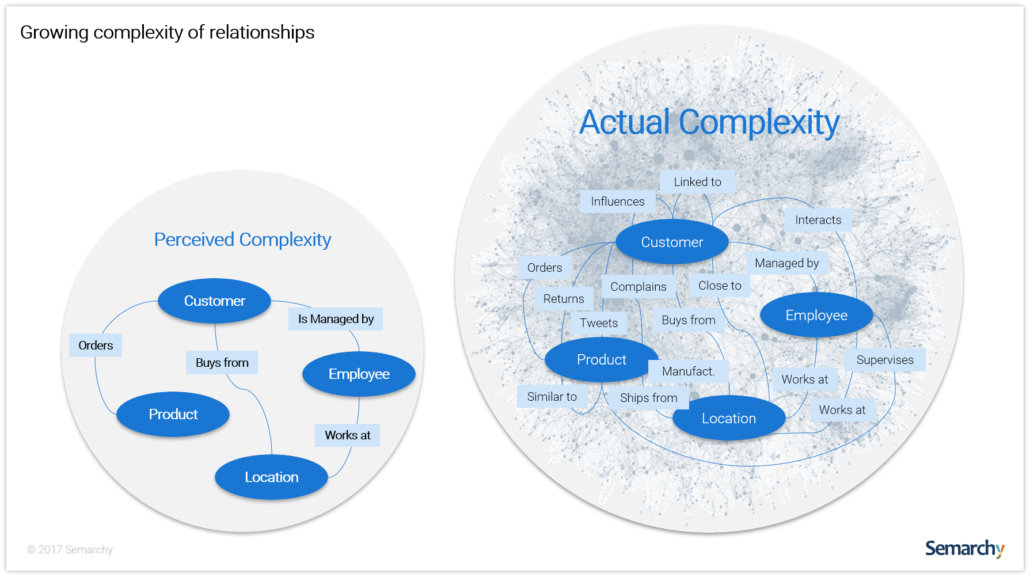
What is the role of Graph Databases in enterprise data management? Salah Kamel from Semarchy argues that at present, Graph Databases are better suited for analytics. While not everyone would agree, Kamel makes a compelling case for using Graph for Master Data Management, touching upon semantics, querying and visualization.

MDM and Graph
The true role graph databases will play in the future of enterprise data management is nuanced. There certainly is value to be gained from a graph database in its ability to get access to poorly attributed data (nodes with little properties) and highly scattered and volatile relationships.
Amazon Neptune on the other hand is aiming first and foremost at operational applications. We’ve covered Neptune in detail, now it’s Tony Baer’s turn to look under the hood. What he finds is that Neptune is more like 2 Graph Databases in 1: one part RDF, one part LPG, and it’s an either/or thing unfortunately. Amazon may want to unify those at some point, but that’s not going to be easy, or happen anytime soon

Looking under the hood at Amazon Neptune
At re:Invent, Amazon Web Services announced the preview of the latest edition to its cloud database family: Amazon Neptune, a graph database that, unlike most rivals, lets you model graph data both ways.
Speaking of RDF, and visualization: if you are using RDF, you probably know one of the pains there is visualizing ontologies. WebVOWL is a Web-based visualization tool that can make understanding and navigating ontologies easier, and it just got an update.

WebVOWL: Web-based Visualization of Ontologies
WebVOWL is a web application for the interactive visualization of ontologies.
Another oft-cited pain point with using RDF Graphs is querying. SPARQL is not top of mind for many people, and even for those for whom it is, there is one part they could live without: parsing results to the format they want them to be. SPARQL Transformer is an interesting idea that lets you use JSON both as a query language, as well as a specification of the format you would like to get results in.

Transforming the JSON Output of SPARQL Queries for Linked Data Clients
A JSON-based query syntax. A JavaScript module for NodeJS/the browser
Interested in Deep Learning, and Graphs? Actually those 2 go well together. David Mack from Octavian demonstrates how you can connect your Graph to TensorFlow and predict reviews with 97% accuracy.

Review prediction with Neo4j and TensorFlow
We show how to create an embedding to predict product reviews, using the TensorFlow machine learning framework and the Neo4j graph database. It achieves 97% validation accuracy.


Has one comment to “New releases, algorithms, and visualization. The Year of the Graph Newsletter Vol. 2, May 2018”
[…] Read the full article on the Year of the Graph […]