Here we go: The Year of the Graph Newsletter Vol. 1, April 2018

Graph databases are the hottest thing around right now. Whether you are just getting started, or you are in one of the 51% of organizations already using them, this is the place to get your news and analysis.
The popularity of graph databases has gone through the roof almost overnight it seems. Everything points this way: the trend lines from database engines, the reports from the Forresters of the world, the response to my graph-related ZDNet posts.
Why is that, and should you care? Do you really need a graph database, and if yes, how do you choose one? That’s the million dollar question.
Well, that’s more than one questions actually, and that’s more than a million in value there too. Either way, i can help you answer, starting today.
This is the first edition of the Year of the Graph newsletter. Every month i will collect, republish, and comment on the most important Graph database related news items.
Why me? Ever since i implemented my first graph database prototype in 2005, i have worked on award-winning research, consulted the (then) leading vendor on distributed query implementation, and lead teams of all sizes and shapes working with graph databases.
I have also published a number of reports and articles with analysis on big data, distributed systems and analytics with Gigaom and ZDNet. Perhaps more importantly though:
I work for nobody else but me, and by extension, you. No fluff, just stuff. No automatically harvested or sponsored posts. No vendor affiliations or hidden agendas. Just hand picked, curated content, and objective, concise analysis.
Why the year of the graph? Glad you asked. In a nutshell, because graph databases are coming of age and getting attention. Some of it has to do with the infrastructure and the technology enabling graph to get mainstream. The use cases have always been there, and heavyweights like AWS and Microsoft are moving in this space.

The year of the graph: Getting graphic, going native, reshaping the landscape
It’s official: graph databases are a thing. That’s the consensus here on Big on Data among fellow contributors Andrew Brust and Tony Baer. When AWS enters a domain, it officially signals the upward slope of the hype cycle.
How do you model you graph? This is the question Dilyan Damyanov from Snowplow explores. Using graphs is part of what Snowplow does, with an emphasis on managing events. The analysis on different answers on how to model event data as a graph sheds some light on the fine art of modelling graphs.

Building a model for event data as a graph
Graph databases have some key advantages over relational and columnar-relational databases. Graph databases are also often designed for low-latency performance, even relative to query complexity. That can make them a better choice than relational databases for certain applications, such as recommendation engines, especially at scale.
So, you have a Hadoop data lake. There’s graph data in there, and “graphy” queries you can do on that data. ArangoDB’s Max Neunhöffer gives examples of graph use cases, and provides an introduction to some graph algorithms you can use, as well as a walkthrough of how to get started with ArangoDB.

Building a model for event data as a graph
Exploring many small regions of a graph with low latency using specialized graph and multi-model databases.
Graph is a much more natural and efficient paradigm for doing multiple joins (hops) than relational data. Furthermore, graphs also work well together with another mega-trend, machine learning. The inherent structure in graphs can be leveraged in your machine learning algorithms, as Graphistry’s Leo Meyerovich discusses with O’Reilly’s Ben Lorica.
Graphs as the front end for machine learning
The O’Reilly Data Show Podcast: Leo Meyerovich on building large-scale, interactive applications that enable visual investigations.
In their original inception data lakes grant universal access to data in their native formats, yet lack the necessary metadata and semantic consistency for long term sustainability. What can give you that? The combination of enterprise-wide ontologies, taxonomies, and terminology, says Franz Inc’s Jan Aasman.

Harmonizing big data with an enterprise knowledge graph
In addition to streamlining how users retrieve diverse data via automation capabilities, a knowledge graph standardizes those data according to relevant business terms and models
Graph databases come in 2 main flavors. RDF is one of them, and Linked Data is a collection of related standards, including taxonomies, that enable graph-based navigation and querying. If you’re interested in the foundamendals of this approach, this account of the Network for Information and Knowledge Exchange’s workshop may be for you.
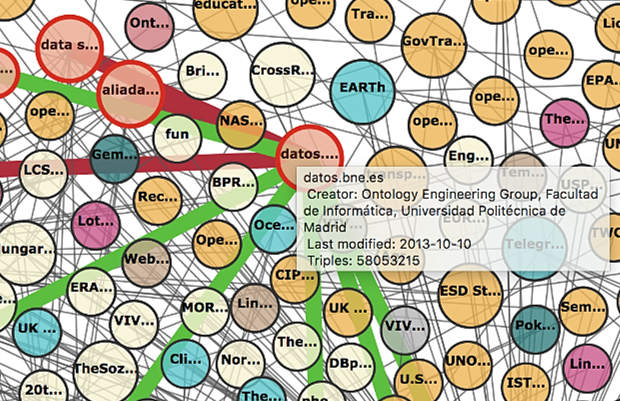
Making true connections in a complex world – Graph database technology and Linked Open Data
Dion Lindsay introduced the concepts behind ‘graph databases’, and David Clarke illustrated the benefits of the Linked Data approach with case studies, where the power of a graph database had been enhanced by linking to publicly available resources.
If you think a taxonomy sounds fancy, how about an ontology? As Teodora Petkova from Ontotext argues, this is not about a philosophical debate on the essence of being. In order to define what something “is” (to a computer program), information technology resorts to the use of ontologies. Some graph databases use those – this is how you build a knowledge graph.

Whose Meaning? Which Ontology?
An ontology is what computer science uses to tackle the messy matter of meaning. In order to define what something “is” (to a computer program), information technology resorts to the use of ontologies.
The other graph database flavor is LPG – Labelled Property Graphs. One of the differences between RDF and LPG is support for taxonomies and ontologies, and as a consequence of this, inference: RDF has it, LPG does not. Or at least, that was the case up to now, says Thorsten Liebig from derivo GmbH. Their solution wants to support RDF-like reasoning on LPG.

Neo4j: A Reasonable RDF Graph Database & Reasoning Engine
Neo4j is able to load and write RDF. Until now, RDF – and certainly OWL – reasoning have been attributed to fully fledged triple stores or dedicated reasoning engines only.
Titan, an open source LPG graph database, was an important piece of the graph database world. As Titan is no longer maintained, IBM and others have been supporting a group of people who stepped up and adopted its codebase, forking it as JanusGraph. Ted Wilmes from Expero is one of the architects of JanusGraph, and he recently spoke about the state of JanusGraph in 2018.

Ted Wilmes on the state of JanusGraph 2018
Ted Wilmes of Expero gave the Graph Keynote for Data Day Texas 2018.
What is the current status quo in the graph database world? All the latest developments from AWS, Cambridge Semantics, Neo4j and Tigergraph, in the “best overview of the graph database world(s) so far“, plus analysis on the options for querying graphs.

Back to the future: Does graph database success hang on query language?
If the history of relational databases is any indication, what is going on in graph databases right now may be history in the making.
Would you like to receive the latest Year of the Graph Newsletter in your inbox? Easy – just signup below. Have some news you think should be featured in an upcoming newsletter? Easy too – reach out here.
Related posts:
 The evolution of the graph technology and business landscape in 2025. The Year of the Graph Newsletter Vol. 27, Spring – Summer 2025
 Return of the Graph: Geospatial Knowledge Graphs, Personal Knowledge Graphs, and Evolution. The Year of the Graph Newsletter Vol. 24, Spring 2023
 Graphs, analytics, and Generative AI. The Year of the Graph Newsletter Vol. 25, Winter 2023 – 2024
 Knowledge Graphs and Natural Language Processing. The Year of the Graph Newsletter Vol. 15, July/August 2019

