Graph is the new star schema. The Year of the Graph Newsletter Vol. 28, Autumn 2025

Are graphs really the new star schema? What do graphs look like to non-insiders, and what is it that attracts them to the graph community, methodologies, applications, and innovation?
In the process of connecting with Connected Data London 2025 speakers, we found ourselves engaging in conversations reflecting and elaborating on the origins and evolution of the community and the technology it converges on: Knowledge Graphs, Graph Analytics, AI, Data Science, Databases and Semantic Technology.
The way we described it was – a core of early adopters that have been around for what can be more than a decade by now, plus a growing segment of newcomers who stumbled upon graphs prompted either by GenAI or by the realization that graph is the best way to model connectedness.
Everything is connected. Graphs exist to model connections. This is why graphs are everywhere. Today, there are more data points to be connected than ever before. There are also more connections made faster than ever before. And people are realizing and leveraging the importance of these connections more than ever before.
This is why there is an explosion in adoption, thought leadership, tools, features, applications and methodologies around graphs. This issue of the Year of the Graph reflects this. Even though it’s only been 3 months since the previous one, and the targeted curation approach hasn’t changed, it’s the longest issue to date.
This issue caters to everyone – from newcomers to experts, and from strategic thinkers and modelers to engineers and scientists. From graph support on Microsoft Azure, GitLab, Netflix, S&P and SAP, to semantics and agents on Databricks and Snowflake, ontologies, knowledge graphs and AI, graph transformers, and science breakthroughs.
To meet the leaders and innovators shaping Knowledge Graph, Graph Databases, Semantic Technology and Graph Analytics / Data Science / AI, come to Connected Data London 2025 on November 20 – 21.
This issue of the Year of the Graph is brought to you by G.V(), metaphacts, Linkurious, and cognee.


If you want to be featured in an upcoming issue and support this work, reach out!
Announcing the State of the Graph project
A comprehensive and up to date repository, visualization, and analysis of all offerings in the graph technology space.
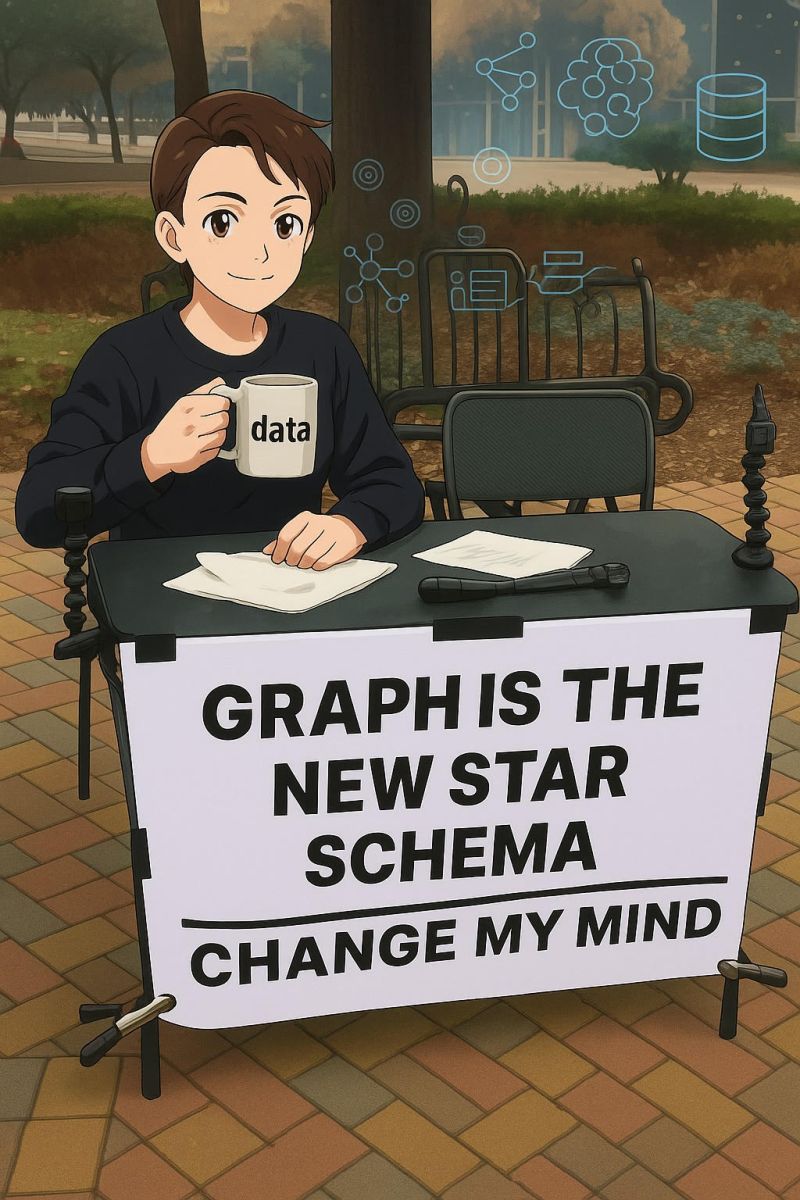
Graph is the new star schema
Is graph really the new star schema? Irina Malkova, VP Product Data & AI at Salesforce, thinks so. Before AI, Malkova didn’t feel like graph metadata was an ROI positive investment for her team – even though they never looked too closely.
Now, however, Malkova realizes that agents can’t be autonomous unless data is structured as a graph. Just a few days after Malkova voiced this realization, her post attracted graph leaders who shared more background and context.
As she puts it, we’re living through the third wave of graphs, now driven by the need to feed data to AI agents. Malkova wonders what it would be like if graph insiders and newcomers all reimagined their jobs by learning from each other.
What do graphs and the data warehouse star schema have in common? They are ubiquitous, and they help unlock value for organizations. Unlike the star schema, however, graph data models are flexible and can unambiguously model semantics. Put another way – graph schema is the star of schemas.
As Charles Betz, VP, Principal Analyst at Forrester notes, without well-defined processes and resilient architectures, the acceleration that GenAI brings risks amplifying chaos instead of streamlining workflows.
The key lies in building a robust IT operating model that integrates GenAI into the fabric of management systems. Graph databases and retrieval-augmented generation are foundational technologies for this transformation.
Graphs represent entities and relationships flexibly, allowing GenAI to reason across complex data landscapes. By investing in graph-based knowledge infrastructure, organizations can unlock the full potential of AI while ensuring transparency, traceability, and alignment.
Matan-Paul Shetrit, Director of Product Management at Writer, takes this one step further, envisioning graphs as the orchestration layer for firms of the future. In the traditional enterprise, coordination was manual. In the hybrid enterprise, coordination becomes programmable.
This reframes the org chart. It’s no longer the primary map of how work flows. The orchestration graph is: the dynamic, often invisible network of people, agents, and systems connected by delegation logic, execution loops, and escalation paths.
No matter what graph technology you work with, G.V() makes you more productive
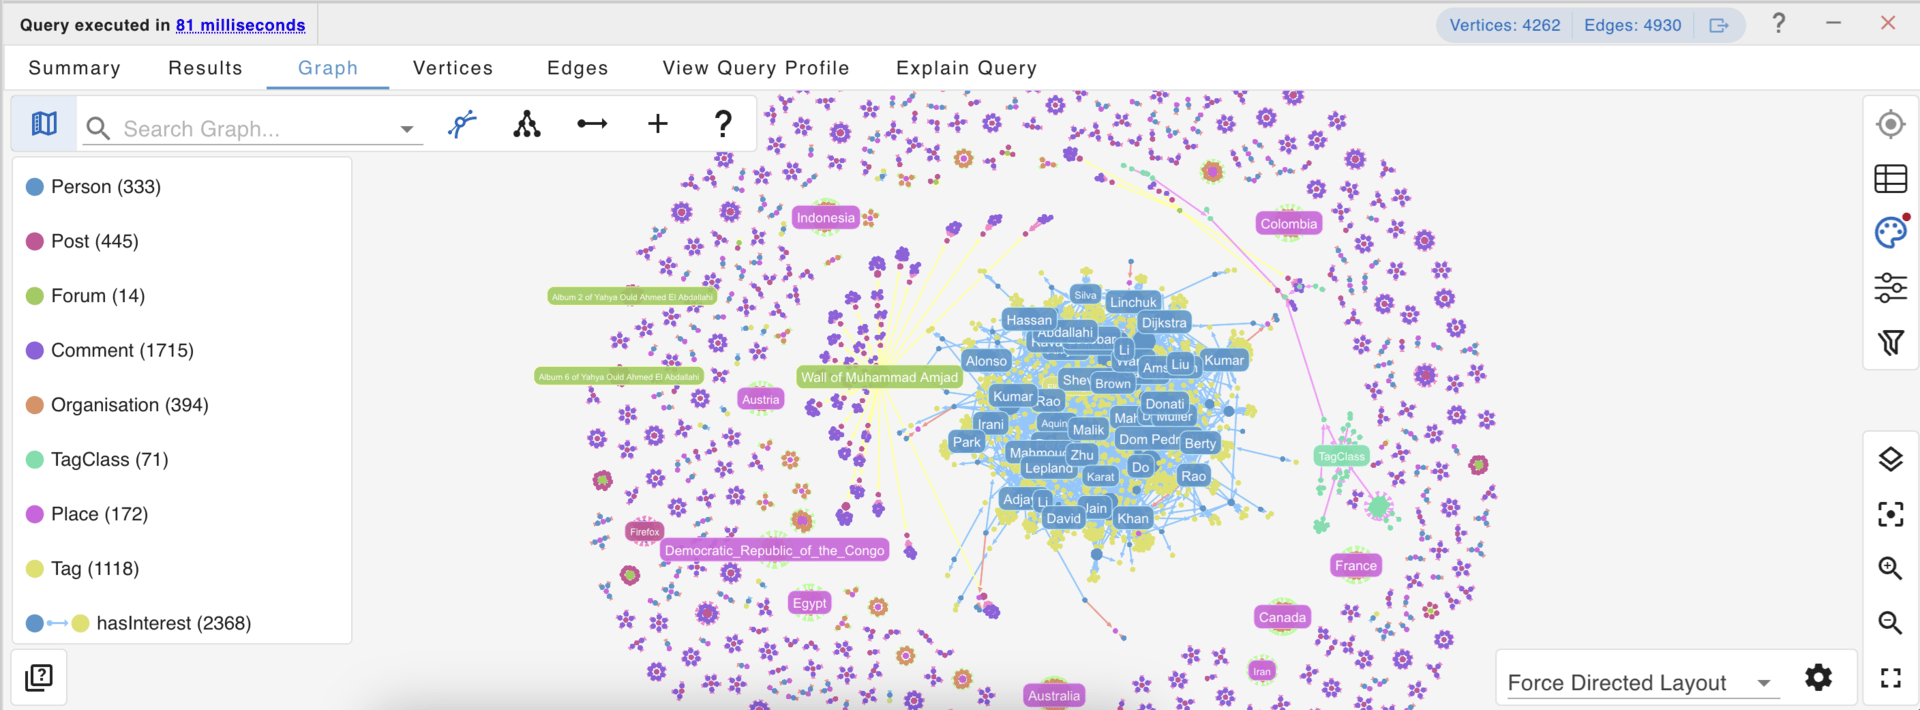
G.V() is a graph database client and IDE that empowers you through every task:
- Write, execute, and profile queries
- Inspect your data model
- Explore your data with high-performance graph visualization
- Add or edit data on the fly
As the most widely compatible graph database IDE, G.V() supports 20+ tools, including Amazon Neptune, Google Spanner Graph, Neo4j, and JanusGraph – and now with GQL support for Ultipa Graph.
Try it out for yourself and start querying your database in less than 5 minutes: gdotv.com
Graphs power Systems of Intelligence
Graphs are evolving alongside GenAI, influencing as well as being influenced by it. According to the Gartner 2025 AI Hype Cycle, Generative AI capabilities are advancing at a rapid pace and the tools that will become available over the next 2-5 years will be transformative.
Al investment remains strong, but focus is shifting from GenAl hype to foundational innovations like Al-ready data, Al agents, Al engineering and ModelOps. The rapid evolution of these technologies and techniques continues unabated, as does the corresponding hype, making this tumultuous landscape difficult to navigate.
These conditions mean GenAI continues to be a top priority for the C-suite. Knowledge Graphs are a key part of this, positioned on the slope of enlightenment. Knowledge graphs are also the foundation for Systems of Intelligence.
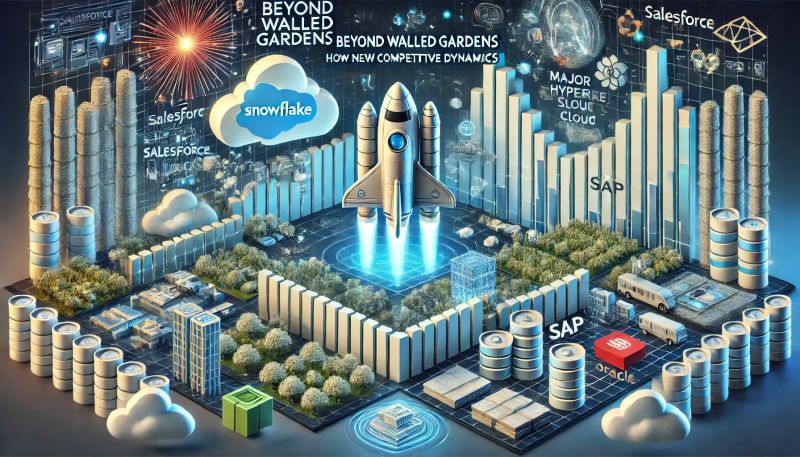
Systems of Intelligence is a term coined by Geoffrey Moore and referenced by SiliconANGLE & theCUBE analysts David Vellante and George Gilbert in their analysis on how Snowflake navigates new competitive dynamics.
Systems of Intelligence are the linchpin of modern enterprise architecture because AI agents are only as smart as the state of the business represented in the knowledge graph. If a platform controls that graph, it becomes the default policymaker for “why is this happening, what comes next, and what should we do?”
A unified semantic knowledge graph for Enterprise AGI
Vellante and Gilbert also zoom in on the importance of semantics in their analysis of how Ali Ghodsi’s data intelligence playbook for Databricks is turning data into agentic advantage. Understanding the strategy lies in recognizing how Systems of Intelligence, Systems of Engagement, and Systems of Agency create a flywheel:
- User Intent Feeds Semantics: Each question ultimately enriches the catalog with richer context, adding meaning to the data so that others can extract more value from it.
- Semantics Feed Agents: Richer context arms agents to make better decisions and ultimately to act autonomously.
- Agents Create Outcomes: Agents deliver outcomes more effectively aligned with business objectives.
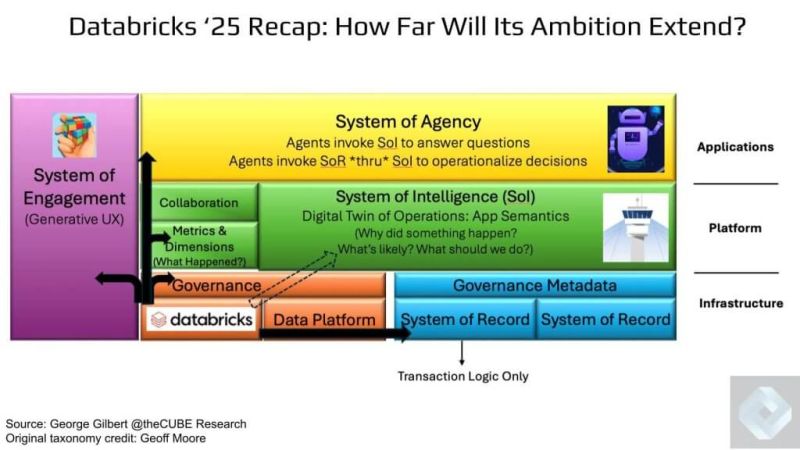
Ali Ghodsi has made the stakes clear, calling owning semantics “existential”. This is the cornerstone of the company’s Data Intelligence strategy. Without harmonized, governed & enriched semantics, dashboards, agents, or operational applications can’t integrate and function.
The goal is to enable agents that not only know what happened, but can also infer why, predict what’s next & prescribe what to do. This is the holy grail of enterprise AI – the foundation for “Enterprise AGI.” Getting there means abstracting beyond RDBMSs and tables, to a unified semantic knowledge graph.
Strategic thinkers realize the importance of owning semantics, and semantic layers matter more than ever in the AI era. This is part of the reason why people are talking about semantic layers – but what is a semantic layer, actually?
Connected Data community members Sofus Macskássy, Jessica Talisman, Juan Sequeda and Andreas Blumauer approach semantic layers from a multitude of angles, sharing definitions and guidelines.
Why AI alone can’t solve all your data problems
.png)
LLMs often “hallucinate” because they rely on broad, statistical patterns, not your business’s unique knowledge. Grounding AI in your semantic models ensures outputs are accurate and trustworthy by leveraging logical connections within enterprise data.
metis is a knowledge-driven AI platform that transforms disconnected data into business value. With metis, you can create and manage semantic models with AI, design and deploy custom conversational agents, and combine tools for summarization, query execution and more.
Use reliable, trustworthy AI that truly understands your business.
Discover metis today!
Defining and building ontologies
Defining semantic layers could be called meta-semantics, which is a bit ironic, but at the same time necessary. Precise definitions is what semantics is all about, and with renewed interest and newcomers in the field, confusion, hype and heated arguments are inevitable side effects.
The same can be said about ontology. When CTOs ponder “what is an ontology” and experts weigh in, the conversation can get pretty technical pretty fast. Others focus on more practical aspects, such as what organizations can learn from the poster child for ontology in use: Palantir.
This points towards another perpetually ongoing conversation: even assuming people agree on what an ontology is, what is the best way to build one? Is ontology engineering really a mess? And why are ontology and data architecture teams solving the same problems with different languages?
Palantir has its own, proprietary definition and implementation of ontology. Some people believe that this is counter-productive. Standards such as OWL, RDF, SKOS and SHACL exist, so there is no reason to reinvent the wheel. Others think that while interoperability is good, those standards are not always fit for purpose, and group think limits evolution.
There is growing consensus that ontologies matter, hard as they may be to develop. Joe Hoeller argues ontology development is hard because it relies on subject matter experts who bring deep understanding of operational language, workflows, and terminology but typically lack the formal training needed to represent that knowledge within rigorous frameworks.
Top Level Ontologies (TLOs) such as the Basic Formal Ontology (BFO), Common Core Ontology (CCO), or SUMO (Suggested Upper Merged Ontology) are such rigorous frameworks. J Bittner explains that TLOs help with ROI in two ways.
First, avoiding reinvention – you don’t need to debate or rebuild basic categories for every project. Second, when domains need to interoperate – finance with logistics, compliance with operations, healthcare with insurance – the shared foundation dramatically lowers the cost of integration.
Using LLMs to support ontology development is something that people like Tony Seale have been advocating. Stardog CEO & Founder Kendall Clark claims that building ontologies leveraging foundational models is “magic” that works via prompt scaffolding, symbolic alignment, formal encoding and iterative validation.
However, Semantic Arts CEO & Founder Dave McComb challenges the notion that getting an LLM to create even a lousy ontology is a good starting point. This, he claims, is premised on the assumption that we need to build a lot of ontologies, as every project needs an ontology.
What we need, McComb argues, are orders of magnitude fewer ontologies. You really see the superpowers of ontologies when you have the simplest possible expression of complex concepts in an enterprise.
This belief is reflected in gist, an open-source, business-focused ontology actively developed by Semantic Arts. Its lightweight design and use of everyday terminology has made it a useful tool for kickstarting domain ontology development in a range of areas. gist is now aligned with BFO.
Regardless of how you choose to build your ontology, tools and methodologies to help do exist. From books such as Introduction to Ontology Engineering, to tools such as the open source Spreadsheet-based Ontology Maker and OntoAligner, a comprehensive modular and robust Python Toolkit for ontology alignment.
Sneak peek: Graph visualization and analytics, reimagined for the cloud
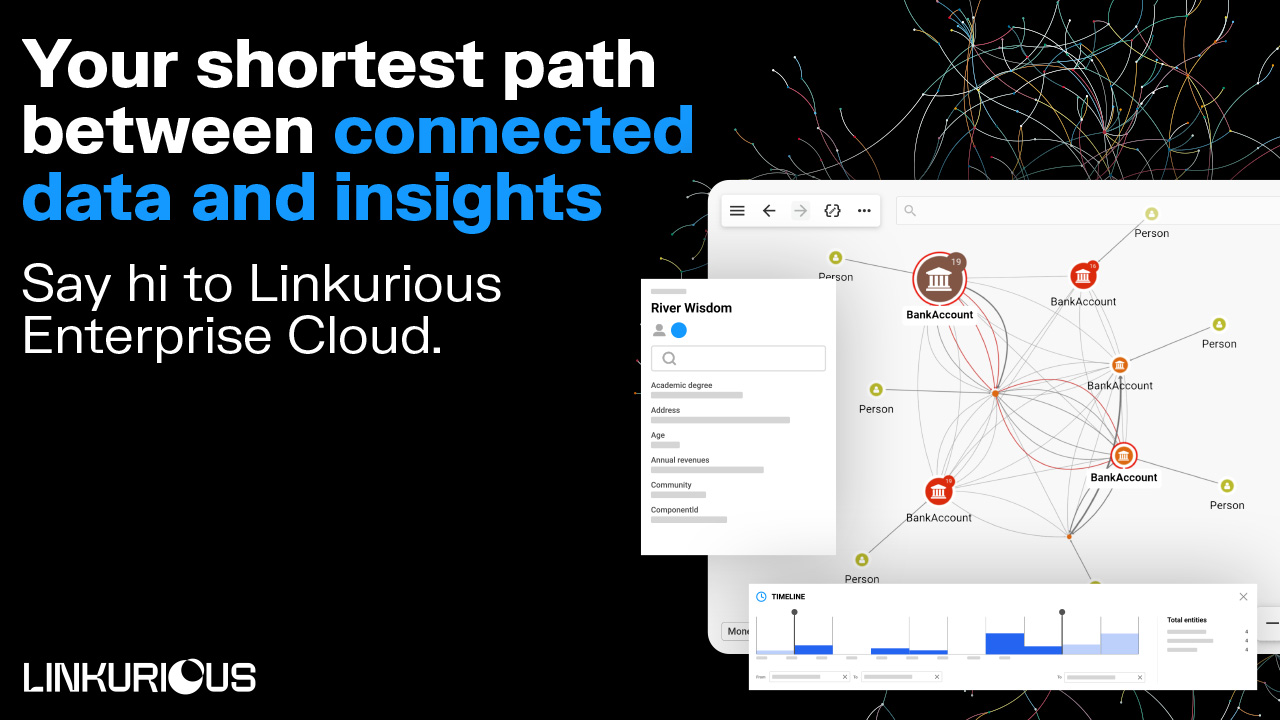
Founded in 2013, Linkurious helps Global 2000 companies and government agencies turn complex connected data into clear insights.
Now, we’re bringing our flagship graph visualization and analytics solution to the cloud. Linkurious Enterprise Cloud (just weeks away from launch…be among the first to try it!) is the most user-friendly, flexible, and scalable way to explore your graph data. In minutes, create an account, connect your graph database, and explore relationships at scale – no infrastructure or maintenance required.
👉 Get early access – join the waitlist for a free trial.
Getting started with knowledge graphs
A semantic layer built with knowledge graphs increases the inherent value of data by enabling faster data integration and improving data quality and trust with contextual relationships and shared models. This is why organizations need to adopt the new paradigm of ECL (extract, contextualize, load) instead of traditional ETL (extract, transform, load) for improved ROI on AI, argues Sumit Pal.
Businesses must ground their AI in knowledge graphs, Joe Hoeller chimes in. First, because your tabular data is dumb, even though your business isn’t. And second, because as opposed to predictive (statistical) inference based on LLMs, ontological (logical) inference based on knowledge graphs is deterministic and explainable.
You may think that knowledge graphs are too complex to implement, or that they need massive datasets. These are just some of the common misconceptions around knowledge graphs that Vasilije Markovic tries to address. But even if you are new to graphs, there are lots of resources to get you started.
In “Relational to Graph“, Frank Blau offers a guide to Graph Thinking. In the “Graph Tech Demystified” series, Paco Nathan shares how to get up to speed on graph fundamentals. Max De Marzi shares graph modeling mastery tips. And if you are looking to land a Knowledge Graph Engineer role, Thomas Thelen compiled a list of interview questions.
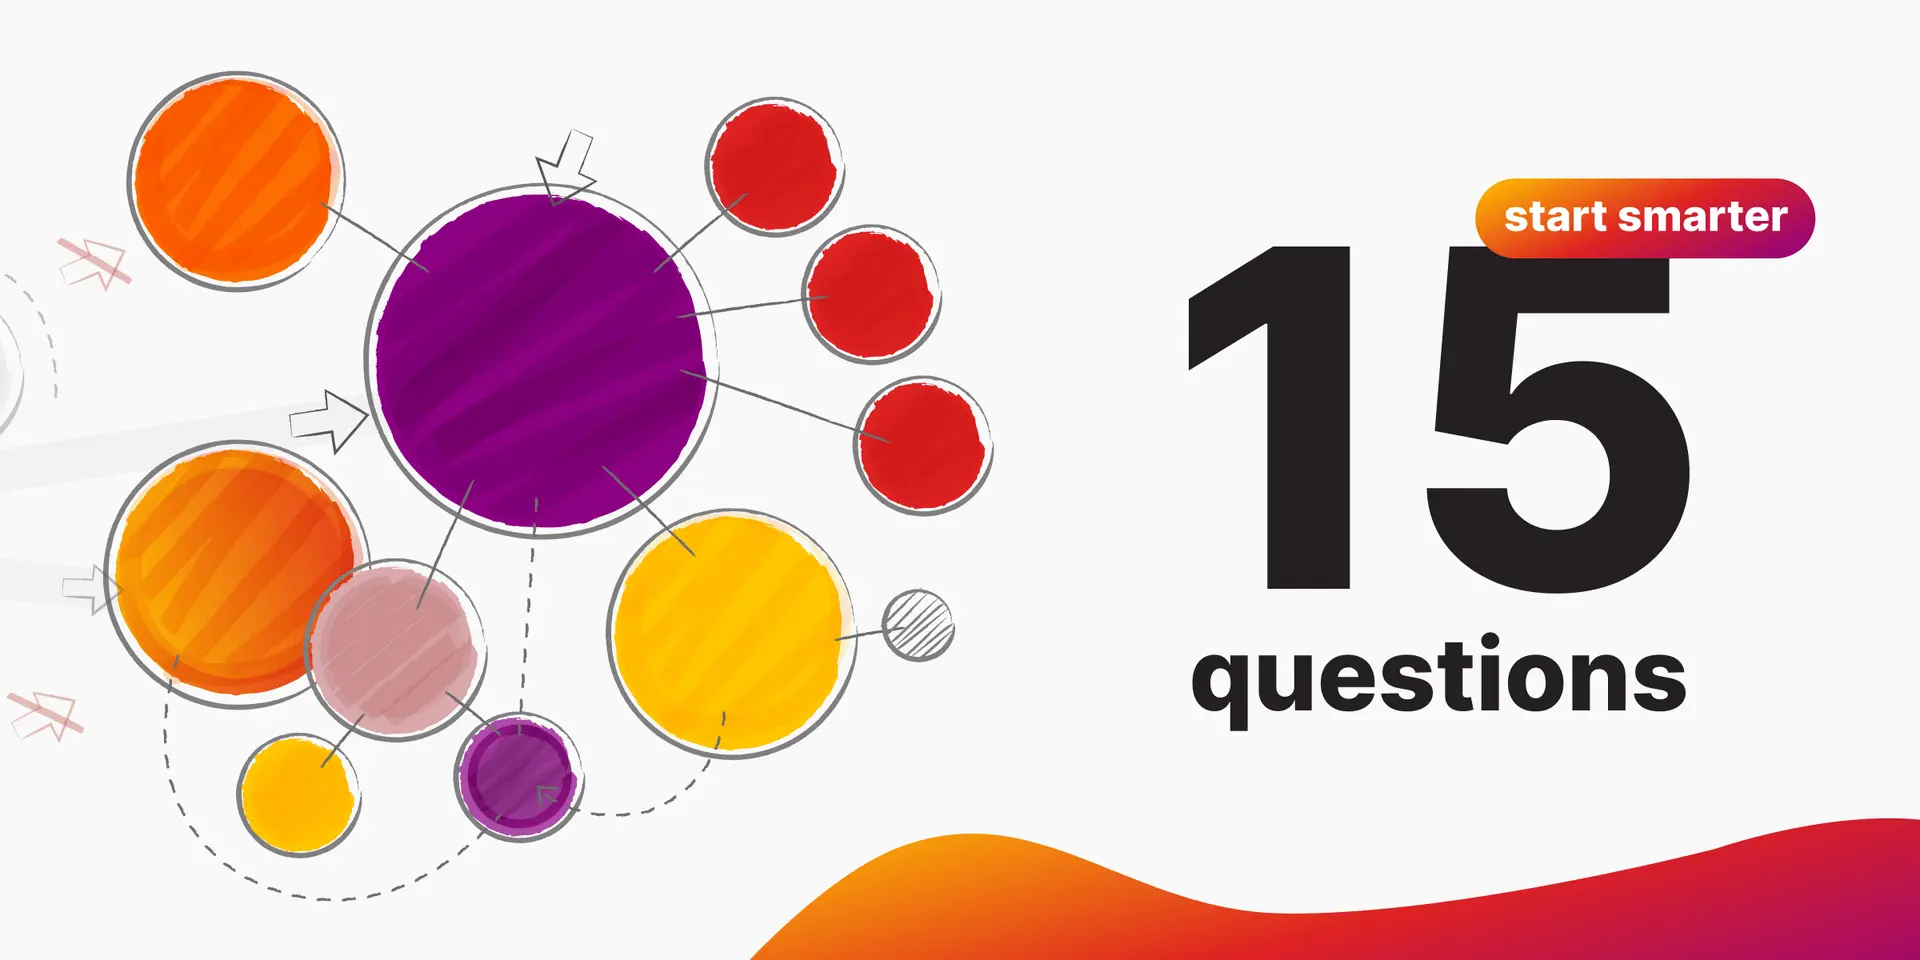
Building a knowledge graph sounds great, but jumping in too early without answering some key foundational questions can lead to wasted time and over-engineering. Sabika Tasneem shares 15 questions to help you start smart, whether you’re building a simple internal graph or planning a complex GenAI-powered system.
Implementing an enterprise knowledge graph is a multi-phase journey. As projects move from an initial proof-of-concept to a fully productionalized, multi-domain graph , costs accumulate. Joe Hoeller breaks down the typical stages (PoC, pilot, and full enterprise deployment) and the costs entailed in each.
Cognee turns any data into a queryable knowledge graph backed by embeddings
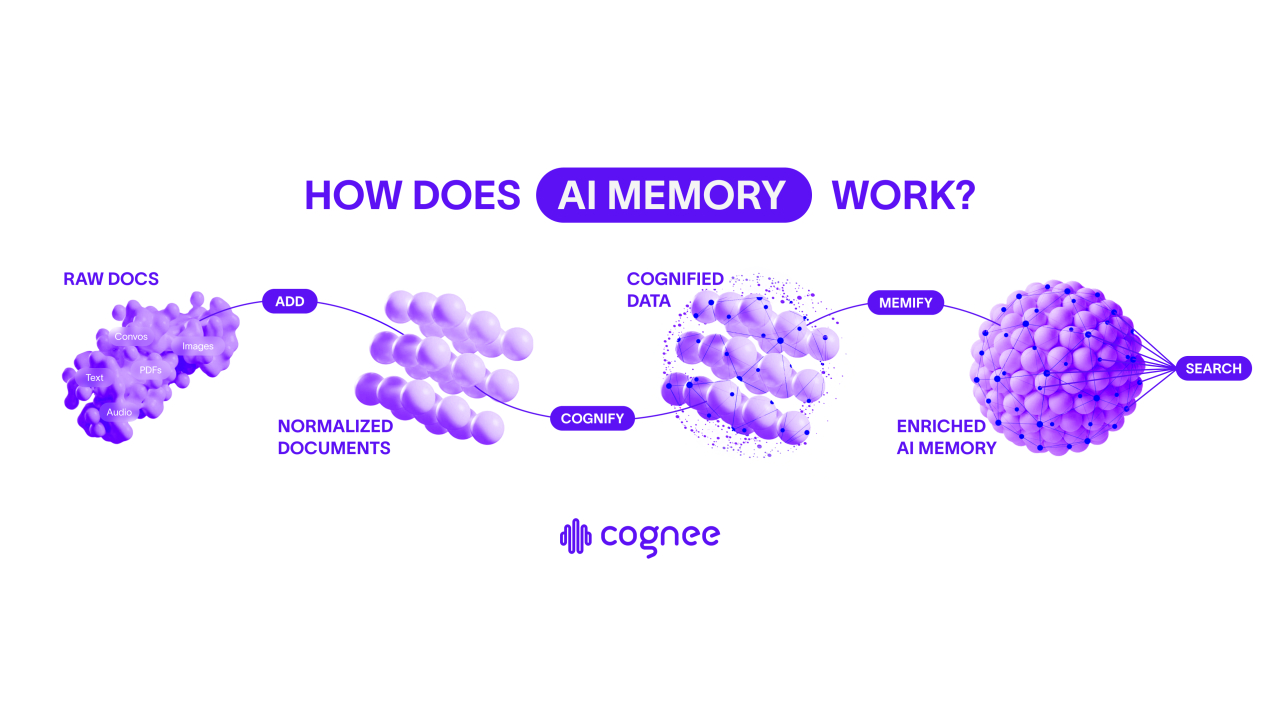
Cognee turns unstructured, structured and semi-structured data into a queryable knowledge graph backed by embeddings.
Cognee retrievers blend vector similarity with graph traversal for precise, multi-hop answers and reproducible context – so agents reason and remember with structure. Add Cognee’s enrichment layer, time-awareness, auto-optimization, and its new UI for an even better experience. For teams building domain-aware agents, copilots, and search for knowledge-heavy domains.
Cognee is open source, with a hosted version – cogwit. Try it.
Adopting, building and populating knowledge graphs
Knowledge graph adoption is peaking. There are more people wanting to build knowledge graphs, and more tools and approaches to do this than ever before.
On SAP, you can now use semantic querying with the SAP HANA Cloud knowledge graph. GitLab’s knowledge graph can be used for codebase RAG, code navigation, impact analysis and architecture visualization. Graph-Code is an open source graph-based RAG system for any codebase.
Synalinks is a Keras-based neuro-symbolic framework that bridges the gap between neural networks and symbolic reasoning. SynaLinks latest release 0.3 features optimized and constrained knowledge graph extraction and retrieval, integration with agents, Neo4j support, Cypher query generation and automatic entity alignment.
Cognee is a modular framework for end-to-end knowledge graph construction and retrieval. A joint post by the cognee and Kuzu teams shows how to transform relational data into a knowledge graph. Similarly, Amber Lennox shares how to go from raw data to a knowledge graph with SynaLinks.
There’s no shortage of tutorials on other tools either. Gal Shubeli shows how to build a knowledge graph from structured & unstructured data using FalkorDB and Graphiti. Thu Hien Vu shares how to extract knowledge graphs from text with GPT4o, and Alain Airom builds a knowledge graph from documents using Docling.
OntoCast is an open source framework for creating knowledge graphs (extracting semantic triples) from documents using an agentic, ontology-driven approach. It combines ontology management, natural language processing, and knowledge graph serialization to turn unstructured text into structured, queryable data.
AutoSchemaKG is a framework for fully autonomous knowledge graph construction that eliminates the need for predefined schemas. It leverages LLMs to extract knowledge triples and induce comprehensive schemas directly from text. AutoSchemaKG is cutting edge research, with the code released on GitHub.
Blue Morpho markets a system that turns PDFs and text files into knowledge graphs. iText2KG, an open source Python package designed to incrementally construct consistent knowledge graphs with resolved entities and relations, can now build dynamic knowledge graphs.
Russel Jurney introduces the emerging field of semantic entity resolution for knowledge graphs, which uses LLMs to automate the most painful part of building knowledge graphs from text: deduplicating records.
Andrea Volpini shares a notebook exploring semantic entity resolution & extraction using DSPy and Google’s new LangExtract library, and Prashanth Rao offers a gentle introduction to DSPy for graph data enrichment.
Subscribe to the Year of the Graph Newsletter
Keeping track of all things Graph Year over Year
Knowledge graphs and AI: a two-way street
In the real world, using predefined entities and relationships while cleaning up and resolving duplicates and flagging inconsistent sources is a requirement for building knowledge graphs.
As Panos Alexopoulos notes, these are the types of knowledge graph quality issues that hamper downstream applications. And trying to automate knowledge graphs may also end up having unforeseen consequences.
The authors of “Knowledge Graphs and LLMs in Action” believe that knowledge graphs and LLMs can work together. They show how to model knowledge graphs based on business needs and unstructured text data sources, how to leverage ontologies, taxonomies, structured data, machine learning algorithms and reasoning.
The relationship goes the other way round, too. As part of their interpretability research, Anthropic introduced a new method to trace the “thoughts” of a large language model. The approach is to generate attribution graphs, which (partially) reveal the steps a model took internally to decide on a particular output.
Anthropic open sourced a library that supports the generation of attribution graphs on popular open-weights models, releasing a frontend to explore graphs. Michael Hunger wrote a script to import the graph json into Neo4j, and Srijan Shukla open sourced code to transform Claude’s hidden memory into interactive knowledge graphs.
In the world of LLMs, the term “context engineering” has been getting traction. LangChain’s CEO Harrison Chase defines context engineering as “building dynamic systems to provide the right information and tools in the right format such that the LLM can plausibly accomplish the task”.
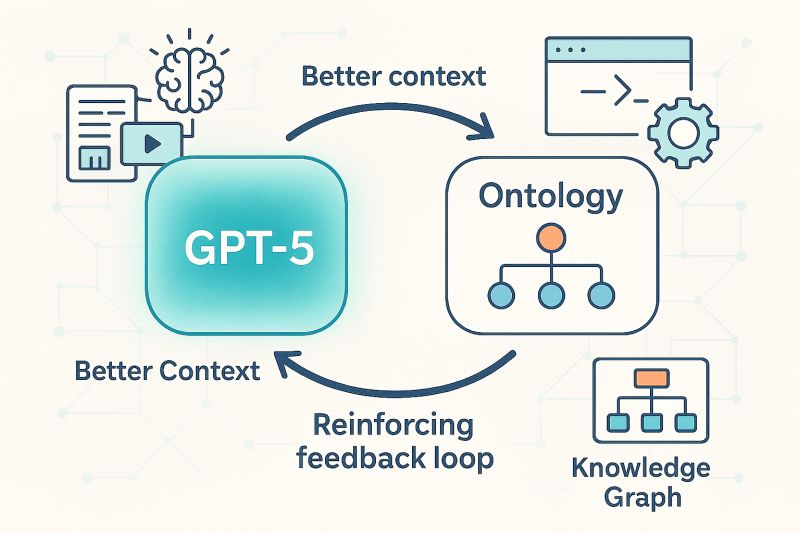
As Jérémy Ravenel notes, context without structure is narrative, not knowledge. And if AI is going to scale beyond demos and copilots into systems that reason, track memory, and interoperate across domains, then context alone isn’t enough. We need ontology engineering.
Context engineering is about curating inputs: prompts, memory, user instructions, embeddings. It’s the art of framing. Ontology engineering is about modeling the world: defining entities, relations, axioms, and constraints that make reasoning possible. Context guides attention. Ontology shapes understanding.
Knowledge graphs backed by ontologies are the ultimate context layer for LLMs. Knowledge graphs excel at providing structured, semantic context to LLMs by organizing information as interconnected entities and relationships, making them great options for Memory and Retrieval, as Anthony Alcaraz notes.
Agentic knowledge graph construction and temporal graphs
Agentic knowledge graph construction is the latest in automated knowledge graphs. The idea Anthony Alcaraz promotes based on a tutorial by Andrew Ng and Andreas Kolleger is to deploy an AI agent workforce, treat AI as a designer, not just a doer, and use a 3-part graph architecture to augment humans instead of replacing them.
The authors of the book “Building AI Agents with LLMs, RAG, and Knowledge Graphs” aim to equip data scientists to build intelligent AI agents that reason, retrieve, and interact dynamically, empowering them to deploy AI solutions. They dedicate a chapter to creating and connecting a knowledge graph to an AI Agent.
Google Cloud released Google Agentspace, which provides a single platform to build, manage, and adopt AI agents at scale for individuals, teams, and enterprises. Google Agentspace is powered by a knowledge graph, built on Spanner Graph.
FinReflectKG is a concrete example of agentic construction and evaluation of financial knowledge graphs, claiming to be the largest open source financial knowledge graph built from unstructured data.
OpenAI released a hands-on guide for building Temporal Agents with knowledge graphs and performing multi-hop retrieval directly over those graphs. While the cookbook focuses on OpenAI models and some other specific tooling, the underlying framework and logic are model-agnostic and easily adaptable to other stacks.
Another approach is shared by Fareed Khan in “Building a Temporal AI Agent to Optimize Evolving Knowledge Bases in Modern RAG Systems“. Khan shows how to create an end-to-end temporal agentic pipeline that transforms raw data into a dynamic knowledge base, and build a multi-agent system to measure performance.
Temporal graph modeling is what TGM focuses on. TGM is a research open source library designed to accelerate training workloads over dynamic graphs and facilitate prototyping of temporal graph learning methods. It natively supports both discrete and continuous-time graphs.
The state of GraphRAG
And what about GraphRAG? Just over a year ago, GraphRAG was the hottest topic in AI. GraphRAG is an emerging set of techniques to enhance retrieval-augmented generation by integrating knowledge graphs, using their structured nature to provide richer, more nuanced context than standard vector search could offer.
Several architectural blueprints for harnessing these graphs to capture the complex relationships between entities were laid out, with the goal of producing more accurate and contextually aware AI-generated responses. Since then, Ben Lorica has been watching for signs of these techniques taking root in practice.
While evidence of widespread adoption is scarce, forward-looking applications are emerging. In agentic AI systems, the graph is evolving from a simple data source for retrieval into a foundational map for reasoning and coordination. The true value of the graph-centric approach becomes clear when applied to agentic AI, Lorica argues.
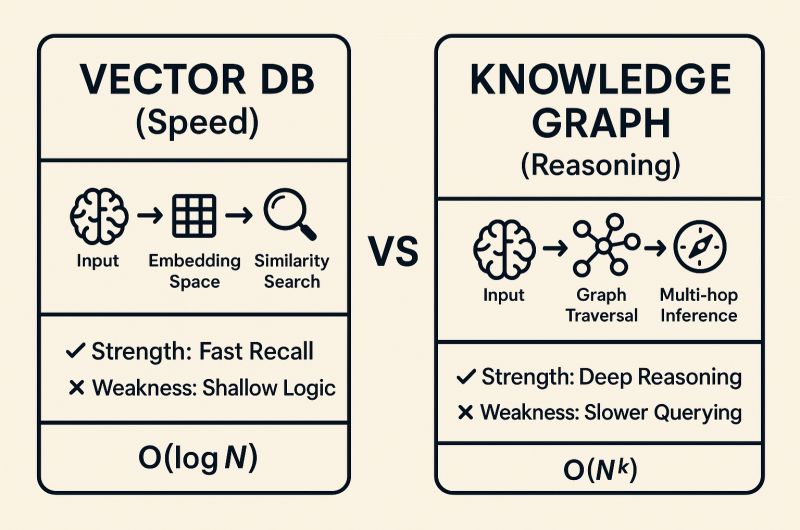
GraphRAG is still hot. Neo4j published the Developer’s Guide to Graph RAG and Essential GraphRAG book. Avi Chawla shares a visual explainer of RAG vs Graph RAG, while a empirical study analyses when and how to use knowledge graphs for RAG. Anthropic’s Contextual Retrieval claims to decrease RAG retrieval error rate by 67%.
There are more new GraphRAG variants too.
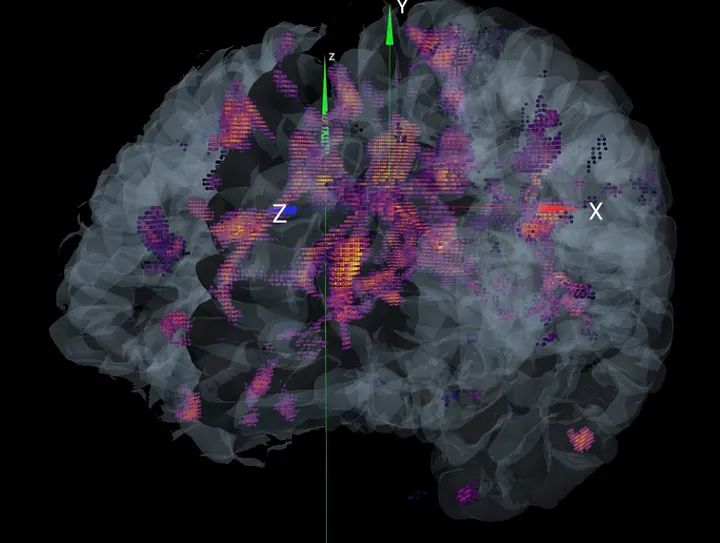
- HippoRAG takes cues from the brain to improve LLM retrieval.
- Graph-R1 combines GraphRAG with Reinforcement Learning.
- DRAG introduces a novel distillation framework that transfers RAG capabilities from LLMs to SLMs through evidence-based distillation and Graph-based structuring.
- HiRAG uses hierarchical clustering to link disparate topic clusters to enhance global reasoning.
Andreas Kolleger highlights innovative approaches from the GraphRAG Track at AI Engineer World’s Fair 2025, and Ben Lorica shares 5 breakthroughs you should know about in RAG Reimagined.
Sergey Vasiliev argues GraphRAG doesn’t lack ideas, but it struggles to scale up. To counter this, Huawei researchers published a pragmatic case study in balancing scalability with reasoning depth in GraphRAG systems.
Multimodal graphs
A topic that’s gaining momentum in GraphRAG and beyond is multi-modality. RAG-Anything is an all-in-one RAG system that leverages multimodal knowledge graphs for automatic entity extraction and cross-modal relationship discovery for enhanced understanding.
multimodal GraphRAG is a framework designed by David Hughes and Amy Hodler to seamlessly integrate visual and textual data for more comprehensive insights and more accurate responses. It combines embeddings that capture visual and audio semantics, graph-based reasoning and explainable outcomes.
Multimodal for Knowledge Graphs (MM4KG) combines structured knowledge representations with deep learning techniques to handle diverse information sources.
In “Towards Multi-modal Graph Large Language Model“, researchers propose a unified framework of multi-modal graph data, task, and model, discovering the inherent multi-granularity and multi-scale characteristics in multi-modal graphs.
Graph databases grow and evolve
Graph databases are exploding, thanks to the AI boom, as Joe McKendrick writes on ZDNet. Graph databases are projected to have a five-year CAGR of 24% – 26% according to Gartner and the Business Research Company, respectively. The overall database market will grow 16% annually.
As AI and RAG have given a significant boost to both graph and vector databases, people are trying to establish how these two compare, and when and how to use each.
Andreas Blumauer compares vector and graph database semantics. Graphs don’t just store facts: they encode logic, preserve causality, and let you do symbolic + neural hybrid search, Shobhit Tankha chimes in. In André Lindenberg’s words: A database tells you what is connected. A knowledge graph tells you why.
Graph databases are bustling with activity. First, we saw the unveiling of not one, but two new vendors in the last couple of months. Tentris, an efficient disk-based graph database for RDF knowledge graphs, is now in open beta. And TuringDB, a low-latency in-memory graph database engine, is now open for early access.
Existing graph database vendors are making progress too.
- Neo4j went HTAP by launching Infinigraph, a new graph architecture that aims to eliminate data silos between transactional and analytical systems.
- Amazon Neptune 1.4.5 introduced engine improvements and support for AWS Graviton-based r8g instances.
- Aerospike Graph Database 3.0 was announced, bringing improvements in developer ease, performance, and cost efficiency.
- Graphwise announced the availability of versions 11 and 11.1 of GraphDB, bringing broad LLM compatibility, MCP support, precision entity linking, native GraphQL support and performance improvements.
- Kuzu v0.11.0 was released, bringing single-file databases, improvements to vector and full-text search indices, and new LLM support.
- TigerGraph announced a strategic investment from Cuadrilla Capital.
GQL, the newly-minted graph query language standard, is seeing adoption. Microsoft is adding GQL support to KQL graph semantics, enabling users to run GQL queries on any Fabric Eventhouse or Azure Data Explorer. Shortly after, Microsoft Fabric started offering graph analysis in Real-Time Intelligence. And Siren is the first investigative platform to offer GQL graph querying integrated with deep search.
For a guide to designing, querying, and managing graph databases with GQL, check the newly released book Getting Started with the Graph Query Language (GQL). And now you can directly run GQL queries in VS Code, thanks to the Ultipa VS Code Extensions.
Graph data models: LPG vs. RDF, OWL vs. SHACL
The LPG vs. RDF debate over graph data models never really goes away. Bryon Jacob explored RDF’s complete stack – identity (IRIs), structure (triples), semantics (RDFS/OWL), queries (SPARQL), and compared it to property graphs. Jacob argues that major enterprises are discovering they’ve been rebuilding RDF piece by piece.
Ora Lassila agrees, and Atanas Kiryakov has a go at debunking urban myths about RDF and explaining how ontologies help GraphRAG; good insights in the comment section. In bridging LPG and RDF frameworks, Enterprise Knowledge share ways to manage and apply a selection of these frameworks to meet enterprise needs.
In his exploration on the future of knowledge graphs, Kurt Cagle claims that we are soon likely to see the unification of LPG and RDF. Cagle also predicts that event-driven and dynamic knowledge graphs SHACL-based modeling will be more important going forward. He follows up arguing it’s time to rethink Linked Data.
People are also debating OWL vs. SHACL. Holger Knublauch, Boris Pelakh, Pete Rivett and Jessica Talisman address this in the great semantic modeling debate, while Michael Iantosca argues that both OWL and SHACL can be employed during the decision-making phase for AI Agents when using a knowledge graph.
Holger Knublauch shares a preview of what is coming in SHACL 1.2. Veronika Heimsbakk’s book “SHACL for the Practitioner” is open for pre-orders. And Kurt Cagle shows how to make pizza with AI and SHACL, and how to use SHACL to validate anything and build user interfaces.
Graph AI: GNNs, graph transformers and foundational models
We have already seen how to approach graph data models and databases coming from the relational world. But what is a ‘relational foundation model’?
The GenAI boom has given us powerful language models that can write, summarize and “reason” over vast amounts of text and other types of data. But these models don’t work for high-value predictive tasks like predicting customer churn or detecting fraud from structured, relational data.
Kumo’s approach, “relational deep learning,” promises to change that. Kumo’s relational foundation model generalizes the transformer architecture to automatically represent any relational database as a single, interconnected graph, and learns directly from this graph representation.
Kumo looks like the first to productize this. However, people in Google and Yandex are working on similar approaches too. Microsoft’s Janu Verma shares his own take on Graph Transformers. The evolution is far from over, and the future of graph AI promises to be even more deeply connected.
![]()
The Connected Data community is a great place for an introduction to Graph Learning and GNNs.The authors of the Geometric Deep Learning textbook have recently added a new chapter on graphs. Jure Leskovec shares what every data scientist should know about Graph Transformers and their impact on structured data.
Wrapping up from the world of graph AI with more new releases. PyG (PyTorch Geometric) is a library built upon PyTorch to easily write and train Graph Neural Networks for a wide range of applications related to structured data.
PyG has evolved significantly since its initial release, establishing itself as a leading framework for Graph Neural Networks. PyG 2.0 is a comprehensive update that introduces substantial improvements in scalability and real-world application capabilities.
GraGOD is a modern approach to time-series anomaly detection using GNN techniques. It is a PyTorch-based framework that provides a flexible and modular architecture for building and training GNN models for anomaly detection.
Graph science: Strong perfect graphs, the new Dijkstra’s algorithm and convergent neural networks
Last but not least, advances on the scientific front for graphs. Starting with a profile on Maria Chudnovsky, the “superstar mathematician” who solved a 40-year-old puzzle about perfect graphs. Chudnovsky’s breakthrough on the Strong Perfect Graph Conjecture shows how abstract math creates real-world solutions.
Speaking of real-world solutions: when we use Google Maps to find the fastest route, behind the scenes, it’s running some version of Dijkstra’s algorithm. That’s been the standard way to compute “shortest paths” since the 1950s. Researchers have found a faster way to run Dijkstra’s shortest path algorithm: something people thought couldn’t really be improved in a meaningful way.
Travis Thompson claims this transfers well into the way data products are built and consumed. Alexander Stage notes that this a great theory milestone, but production routing already “changed the rules” years ago with preprocessing and smart graph engineering.
Miklós Molnár reports on Szegedy Balázs’ work on training neural networks with identical architectures. Results point to the Platonic Representation Hypothesis, according to which neural networks are converging to a shared statistical model of reality. And Alberto Gonzalez shares the basics of representing graphs.
Related posts:
 The evolution of the graph technology and business landscape in 2025. The Year of the Graph Newsletter Vol. 27, Spring – Summer 2025
 Graphs, analytics, and Generative AI. The Year of the Graph Newsletter Vol. 25, Winter 2023 – 2024
 Graph Therapy. The Year of the Graph Newsletter Vol. 20, June / May 2020
 Knowledge graphs, AI, and interoperability. The Year of the Graph Newsletter Vol. 10, February 2019

