The evolution of the graph technology and business landscape in 2025. The Year of the Graph Newsletter Vol. 27, Spring – Summer 2025

Knowledge Graphs and Graph RAG Galore, New Graph Database Engines, Graph Analytics and Visualization, and Graph Foundation Models.
Do you trust market research reports? If you do, here’s evidence #1 to consider: The global knowledge graph market is projected to reach $6.93 Billion by 2030 from $1.06 Billion in 2024, growing at a CAGR of 36.6%.
Do you trust analyst firms? If you do, here’s evidence #2 to consider: As many as 50% of Gartner client inquiries around the topic of AI involve a discussion around the use of graph technology.
Do you trust market signals? If you do, here’s evidence #3 to consider: graph-based products such as RDFox and data.world are powering household products such as the Samsung Galaxy S25 and ServiceNow, following their respective acquisitions.
All of these pieces of evidence point to the same direction: the graph landscape is evolving rapidly in terms of diversity, depth, and density and the outlook is positive, despite ups and downs.
But there’s good reason to read through this round of graph-related news and insights even if you don’t trust, or care about, any of the above. Read on to learn about how to build and visualize graphs, new graph database engines, variants on Graph RAG, a roadmap for graph analytics, and Graph Foundation Models, applications at scale, LLMs and graphs.
This issue of the Year of the Graph is brought to you by G.V(), metaphacts, Connected Data London, and Built to Last.


If you want to be featured in an upcoming issue and support this work, reach out!
You already understand the power of graph technology.
G.V() helps you understand your graph.
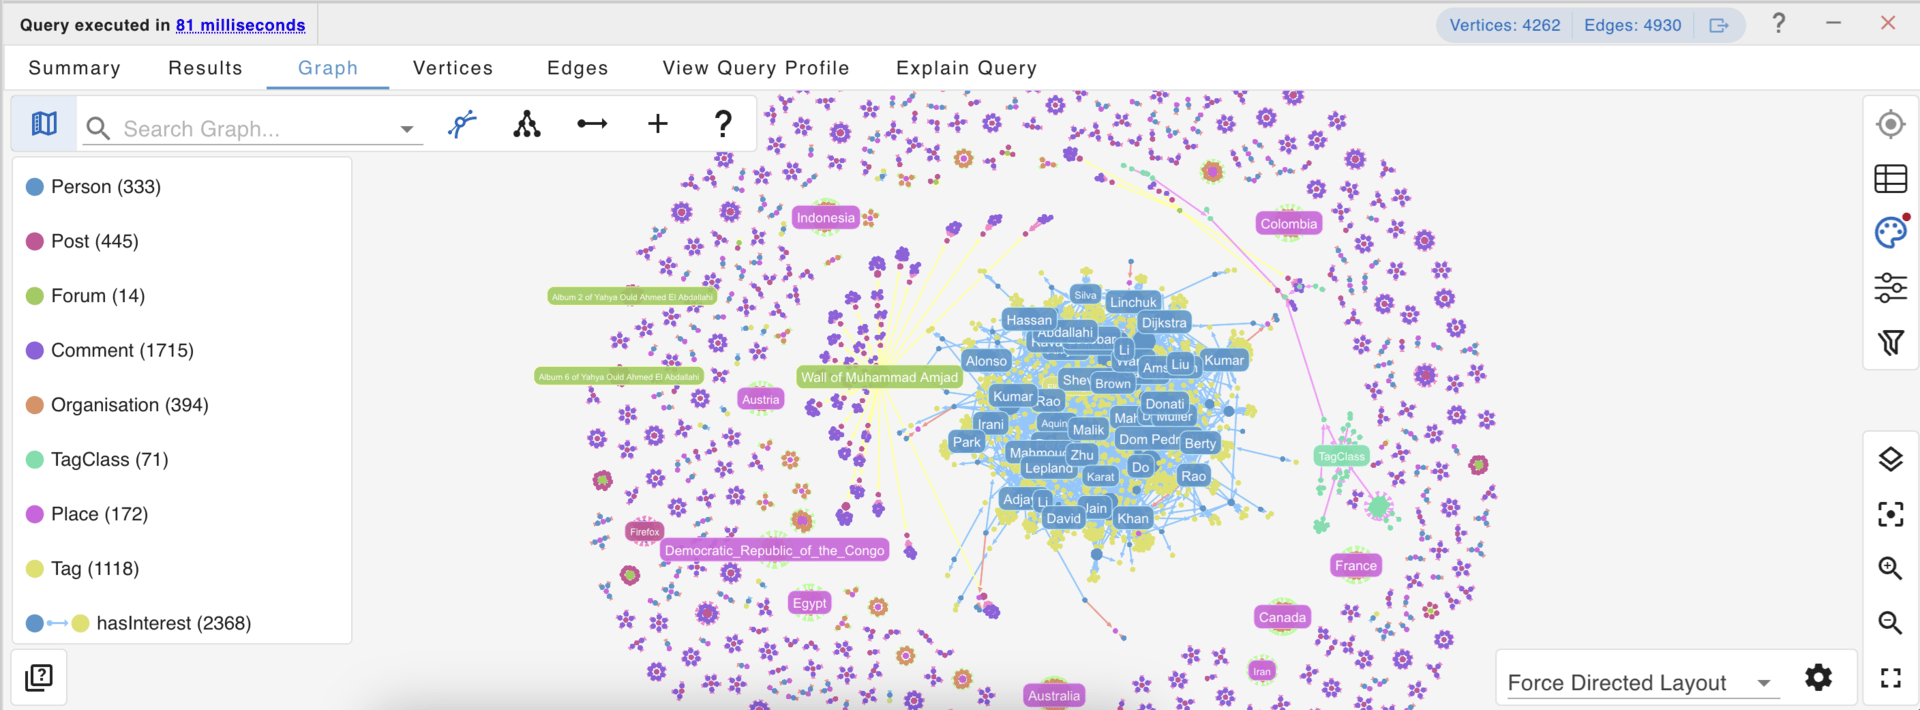 G.V() is a graph database IDE that helps you write, execute, and test queries; track your data model; explore and edit your graph data on the fly; and show your work with powerful graph data visualizations. Compatible with 18 different graph technologies and growing, G.V() is easy to use, low cost, low commitment, vendor agnostic, and plays well with any security architecture.
Try out G.V() for yourself and start querying your database in less than 5 minutes: gdotv.com
The graph technology landscape
The graph technology landscape infographic has been helping map the world of graph technology since 2014. Its goal is to introduce the key categories within the world of graph tech, and key players within those categories.
Of course, as its creators in Linkurious acknowledge, this is just a starting point, not a complete listing. It could not possibly be, for a domain that’s evolving so rapidly both in terms of R&D innovation as well as market growth.
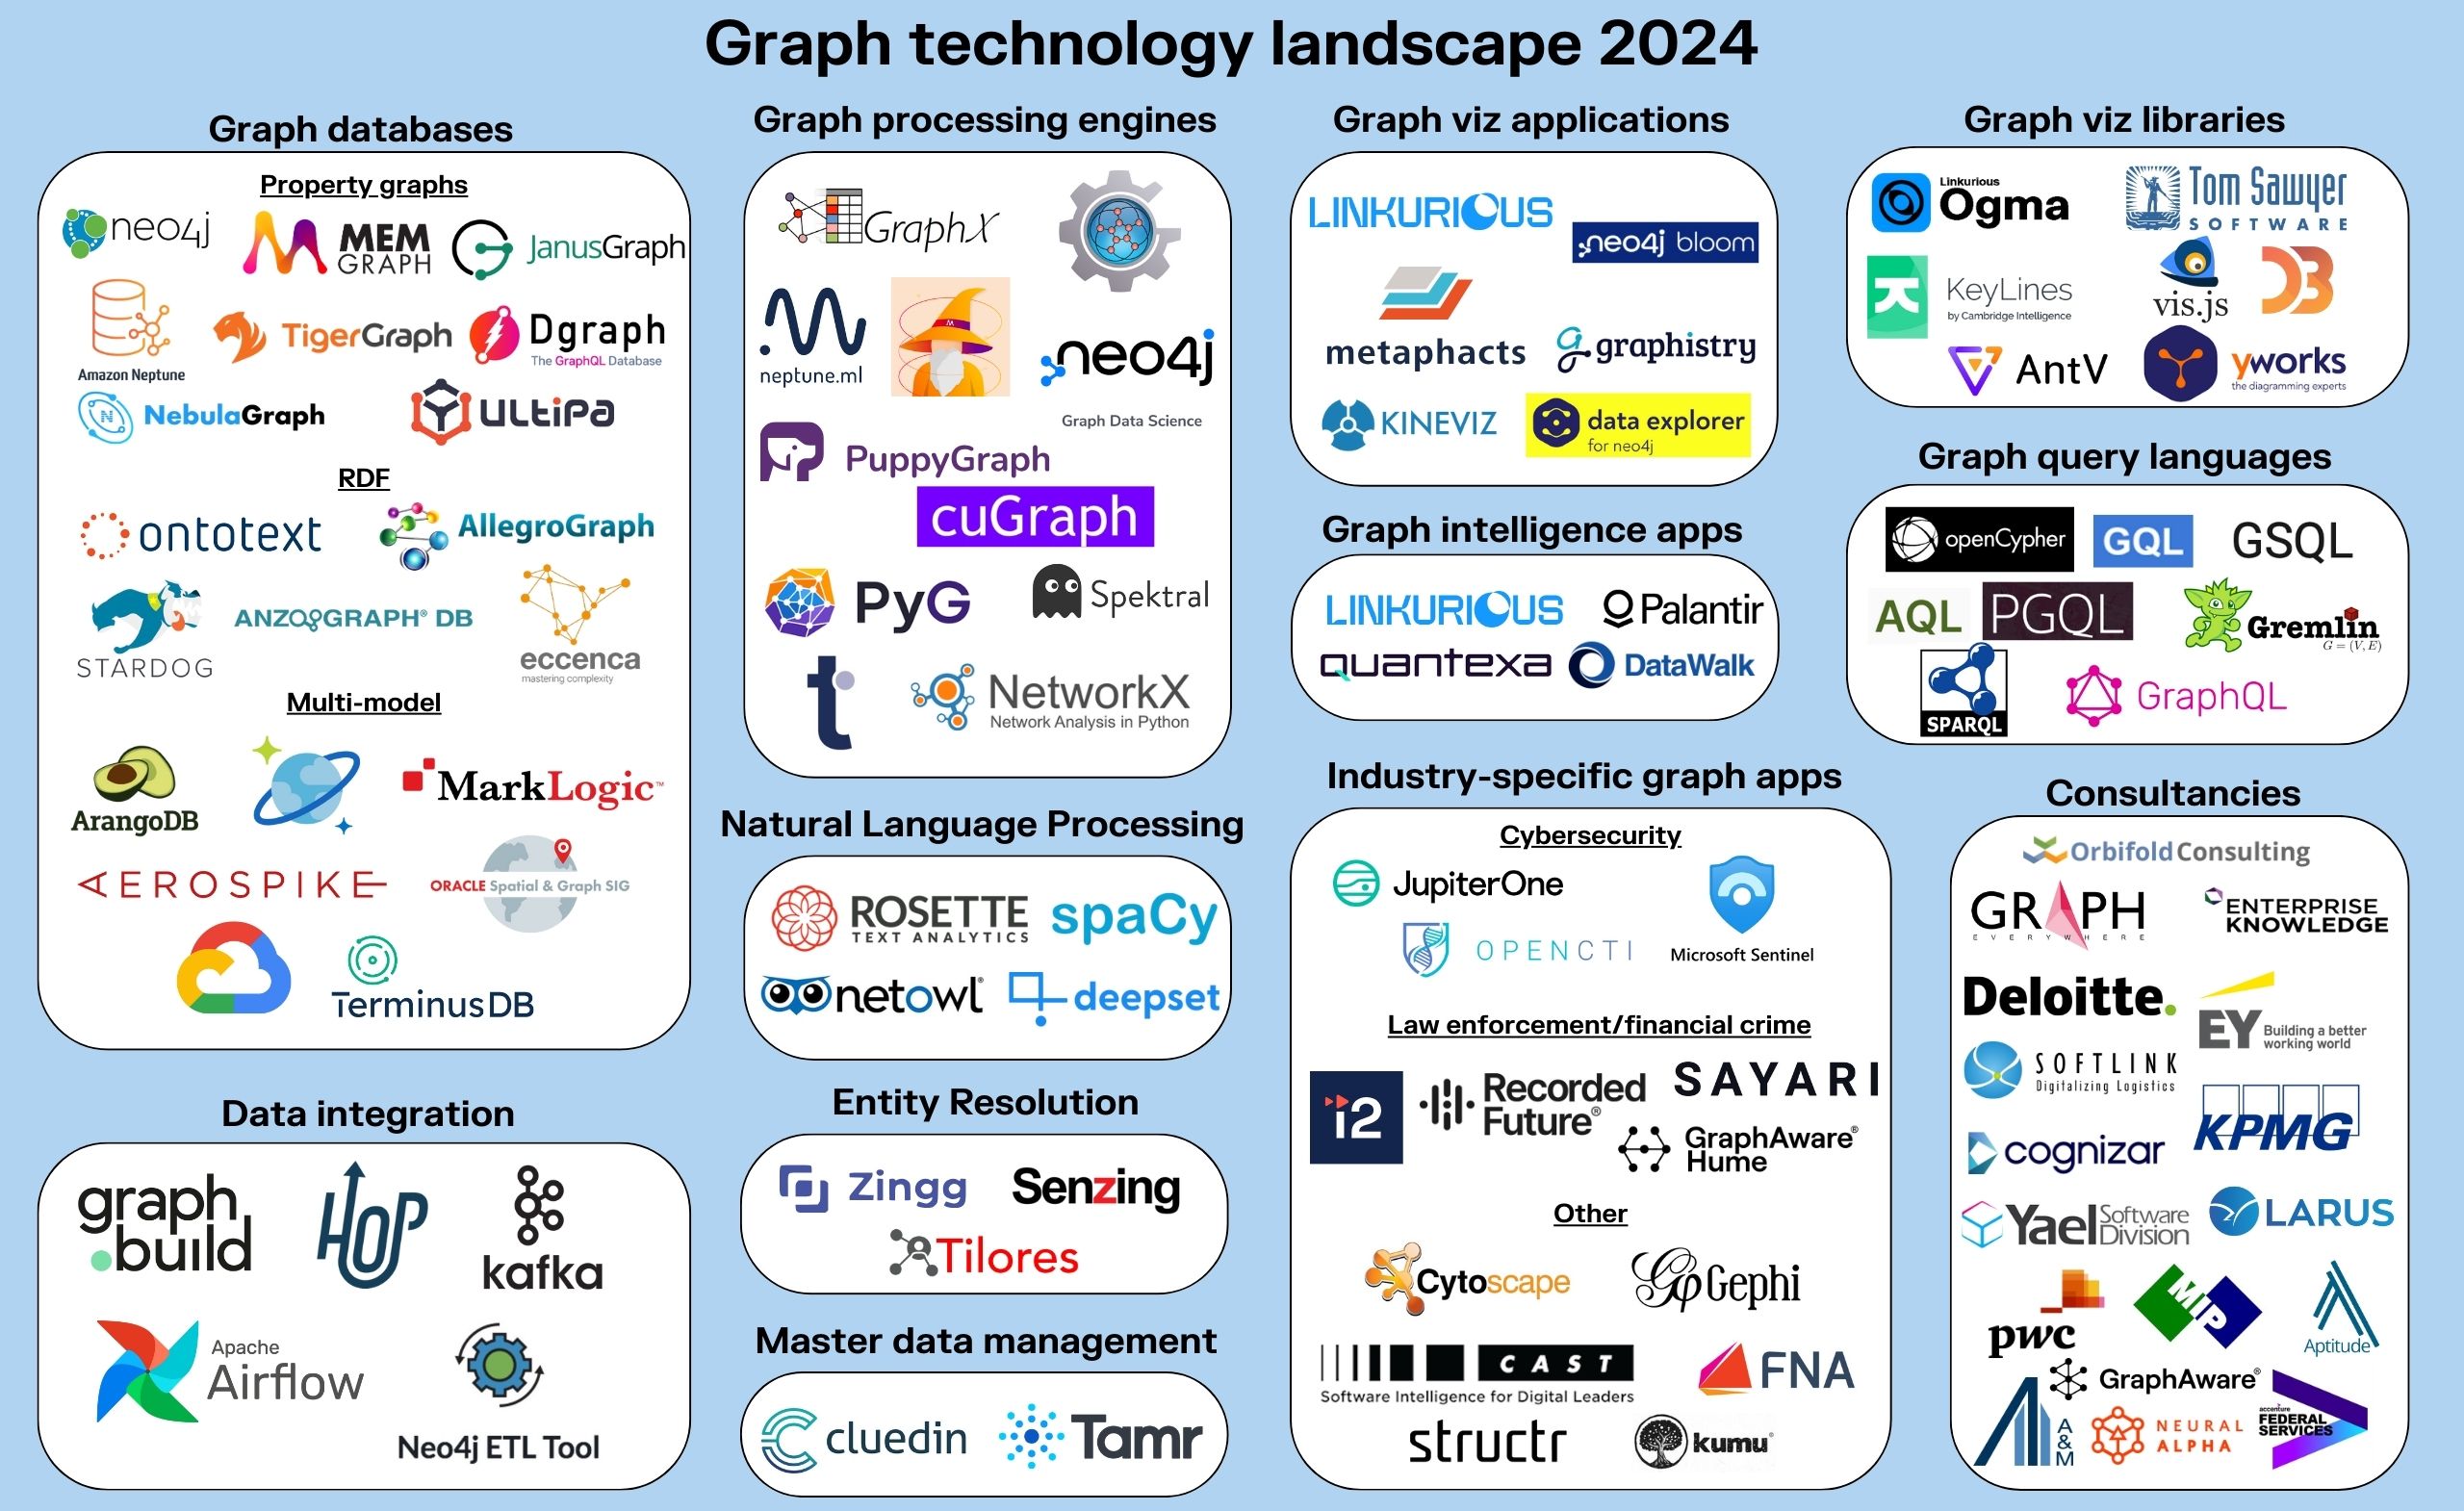 Keeping track of the graph technology landscape requires constant attention and hard work, which is why the infographic and accompanying report are only updated once every 5 years.
The takeaway from the 2025 version is that more and more organizations are adopting graph technology, as they find it to be an asset for an ever increasing number of use cases. Bonus tracks: Graph technologies outlook in 2025 by Paco Nathan, predictions for knowledge graphs in 2025 by Tony Seale, and revisiting another graph tech landscape by Nicolas Figay.
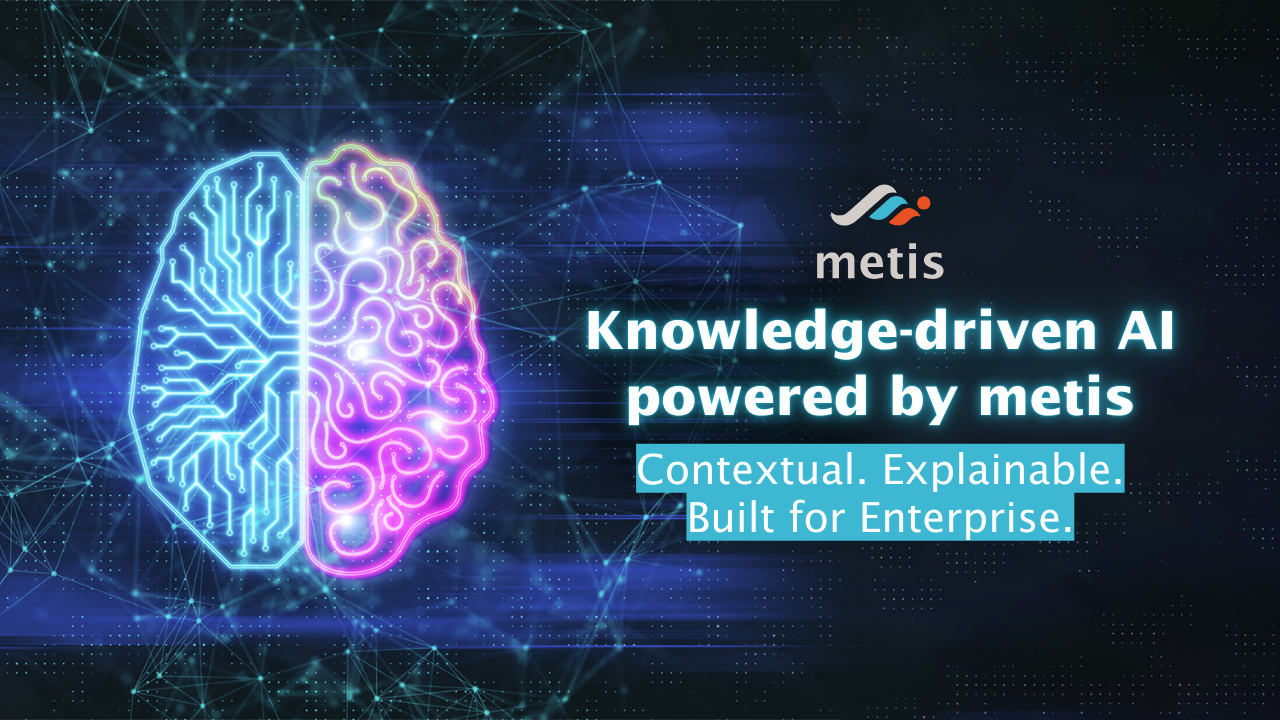
AI you can trust, powered by semantics
When AI lacks enterprise specific context, it’s just guesswork. Coming July 2025, metis is metaphacts’ new knowledge-driven AI platform transforming disconnected enterprise data into real business value.
With metis, enterprises can:
● Ground AI responses in enterprise semantics for accuracy and trust
● Design and deploy custom knowledge-driven AI agents equipped with a
conversational interface
● Control and audit enterprise data usage
● Combine tools like summarization, entity linking and query execution—powered by
business-specific semantics
By grounding AI in semantics, metis delivers AI that truly understands your business, while ensuring security, explainability & trustworthiness. That’s the promise of knowledge-driven agentic AI—and it’s what powers metis.
Contact metaphacts to learn more!
Knowledge graph market outlook
The key drivers for the growing adoption of graph technology, as identified by Research and Markets’ Knowledge Graph Research Report 2025, are the rising demand for AI/generative AI solutions, the rapid growth in data volume and complexity, and the growing demand for semantic search.
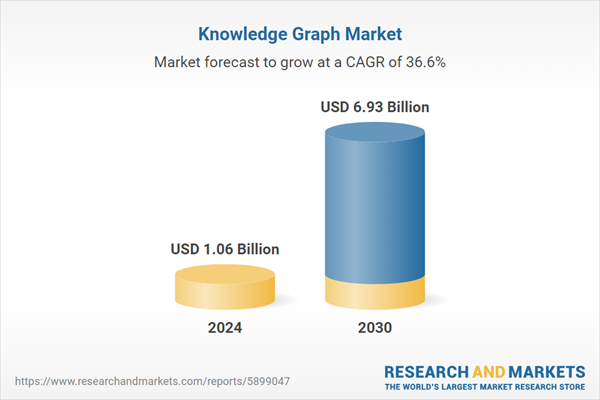
The knowledge graph market is estimated at USD 1.06 billion in 2024 to USD 6.93 billion by 2030, at a Compound Annual Growth Rate (CAGR) of 36.6%. As Research and Markets notes, the Graph Database Engine segment is projected to hold the largest market size, and the services segment is projected to register the fastest growth rate during the forecast period.
Research and Markets notes lack of expertise and awareness as well as standardization and interoperability as the major challenges holding back growth in the market – although that’s changing. Lack of expertise also justifies the fact that services (consulting, presumably) is identified as the fastest growing part of the market.
Connected Data London is back!
The go-to conference for those who use the relationships, meaning, and context in Data to achieve great things.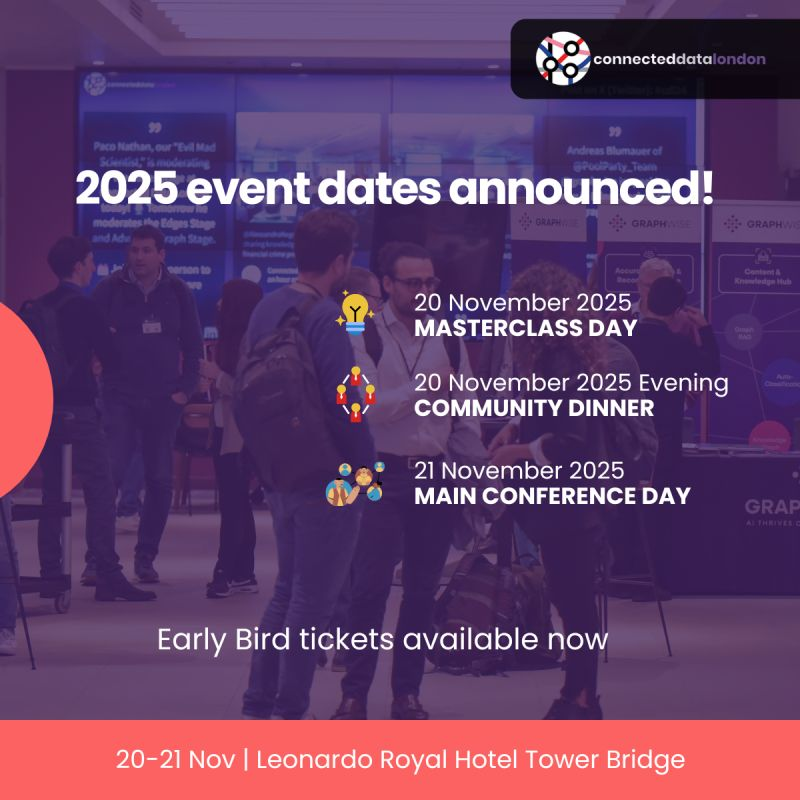
Connecting Data, People & Ideas since 2016. Connected Data London provides a community, events, and thought leadership on all things Knowledge Graph, Graph Analytics, AI, Data Science, Graph Databases and Semantic Technology.
Whether you’re an engineer, data scientist, architect, or decision-maker, this is your chance to connect with the brightest minds shaping the future of Connected Data & the full program of:
🌐 Expert talks
🤝 Networking with innovators
📊 Real-world case studies
🎯 Practical workshops
🥂 Community Dinner
📍 Leonardo Royal Hotel Tower Bridge | 🗓 November 20-21, 2025
🔗 Discounted Early bird tickets now available at 2025.connected-data.london
Building and evaluating knowledge graphs as durable assets
The Research and Markets report identifies “rapid proliferation of knowledge graphs” as an opportunity. While we certainly see signs of this, there are a few points worth making here.
As the popularity of knowledge graphs grows, their implementation complexity underscores the need to evaluate whether they are the right solution for the organization’s use case. This is what Gartner notes in its research note titled “How to Evaluate the Applicability of Knowledge Graphs for Your Use Cases“.
Gartner identified knowledge graphs at the heart of Critical Enabler technologies in its 2024 Hype Cycle for Emerging Technologies, and noted that “Adding Semantic Data Integration & Knowledge Graphs” was one of the Top 10 trends in Data Integration and Engineering for 2024.
However, Gartner finds that even though awareness of knowledge graph use cases is increasing, the willingness or business buy-in to invest in such initiatives is low. The benefits to the business still remain unclear, and organizations are still struggling to figure out when to use knowledge graphs to deliver business value.
As Mike Dillinger notes, rich knowledge graphs are durable assets – assets that have a long life span, providing utility or value over an extended period, usually in a business or economic context. They are typically not intended for sale but are absolutely essential for operations, like other assets such as property, equipment, and machinery. This is an extremely fitting metaphor.
Knowledge graphs are organizational CapEx, and they should be evaluated as such. Measuring their value should be based on what they enable, which ranges from data governance to AI applications.
In “Why Graph Implementations Fail“, Lulit Tesfaye notes that oftentimes, organizations have a limited understanding of the cost-benefit equation. Mel Richey addresses “What It Takes To Build a Great Graph“, and Gartner shares “How to Build Knowledge Graphs That Enable AI-Driven Enterprise Applications”.
Jessica Talisman chimes in with the Ontology Pipeline to power semantic knowledge systems, noting that a structured, scalable approach to semantic knowledge management can justify investments with well-defined ROI metrics and improve data quality and governance, essential for AI success. Jeremy Ravenel shares his experience on where to start when you want to build an ontology.
There’s no shortage of tools for building knowledge graphs either. Yassir Lairgi shared iText2KG, a Python package designed to incrementally construct consistent knowledge graphs with resolved entities and relations. WhyHow open sourced its Knowledge Graph Studio. And OpenSPG (Semantic-Enhanced Programmable Graph) is a new generation of enterprise knowledge graph (EKG) engine, bidirectionally enhanced by LLMs and knowledge graphs.
Knowledge graphs powering household names through mergers and acquisitions
The fact that knowledge graphs represent an investment for organizations who are serious about building AI is being increasingly understood. ServiceNow gets this, and is acquiring data.world to dig deeper into data for AI. As Joe Hilger notes, there is ongoing consolidation in the semantic software industry, driven by GenAI and semantic layers.
“According to a Gartner focus group, 4% of technology leaders believe that their data is AI-ready — that’s pretty sobering. Gartner goes on to say in a separate report that by 2026, 60% of AI projects will fail because the data is not AI-ready.” This is what Gaurav Rewari, senior vice president and general manager of data and analytics products at ServiceNow said in the context of data.world’s acquisition.
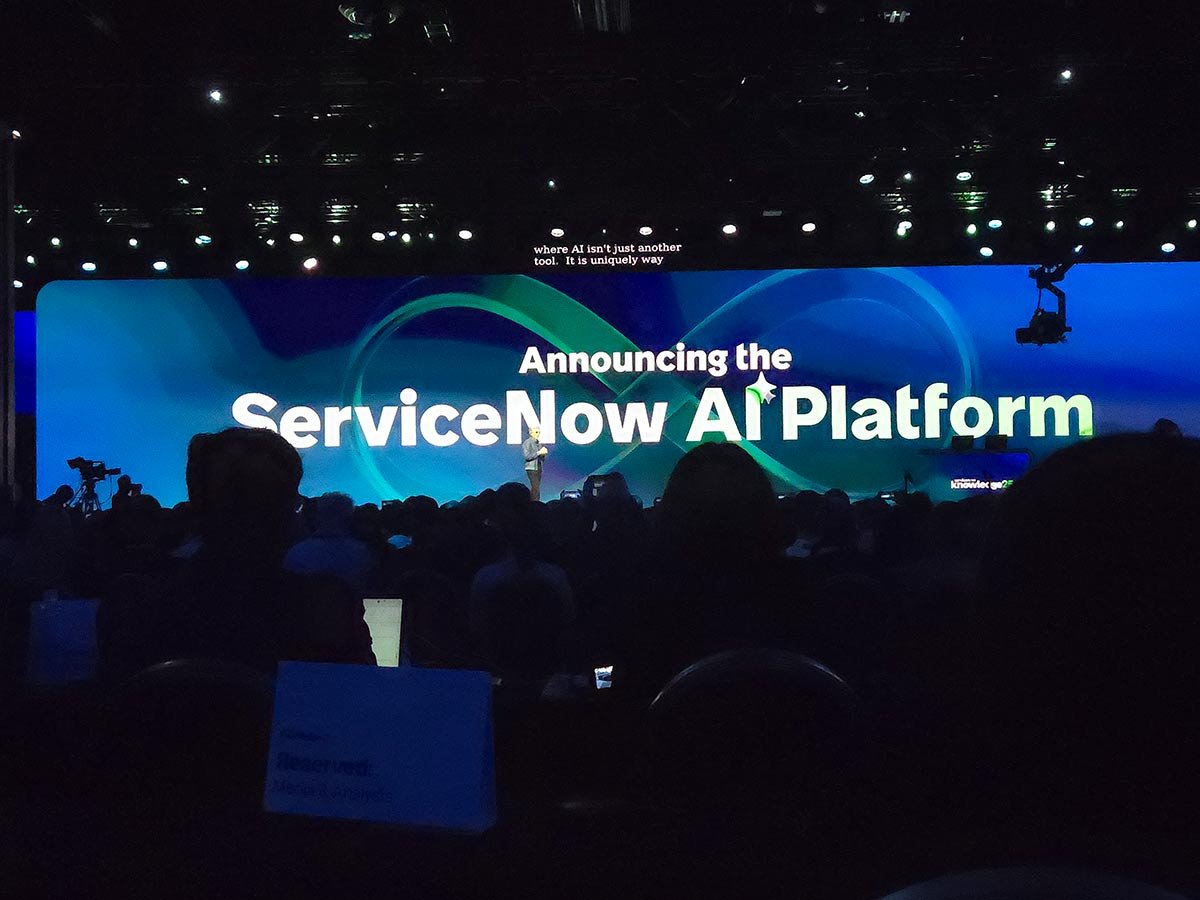
There are other data catalog specialists, but Rewari said Data.world’s knowledge graph implementation made it a good fit for ServiceNow. ServiceNow already has knowledge graph support, but data.world brings metadata collectors and knowledge graph expertise that can enrich ServiceNow’s graph further.
Earlier in the year, Samsung launched the new Galaxy S25 series with new AI features built on technology from Oxford Semantic Technologies. A spinout of Oxford University in 2017 by three of the world’s leading computer science professors in the field of knowledge-based AI technology, Oxford Semantic Technologies was acquired by Samsung Electronics in July 2024.
The company’s RDFox® technology is behind Samsung’s Personal Data Engine to create hyper-personalised user experiences leveraging knowledge graphs, and will be included in the latest Galaxy S25 series. Co-founder Ian Horrocks was among the speakers at Samsung’s Unpacked event.
Subscribe to the Year of the Graph Newsletter
Keeping track of all things Graph Year over Year
Knowledge graphs as the essential truth layer for Pragmatic AI
Organizations are facing a critical challenge to AI adoption: how to leverage their domain-specific knowledge to use AI in a way that delivers trustworthy results. Knowledge graphs can provide the missing “truth layer” for AI that transforms probabilistic outputs into real world business acceleration.
This is the takeaway from an in-depth conversation on knowledge graphs as the essential truth layer for Pragmatic AI with Tony Seale. It addresses everything from knowledge graph first principles to application patterns for safe, verifiable AI, real-world experience, trends, predictions, and the way forward. Seale, also known as “The Knowledge Graph Guy”, is the founder of the eponymous consulting firm.
Some related background material: “What are the Different Types of Graphs? The Most Common Misconceptions and Understanding Their Applications“, as well as “What is Semantics and Why Does it Matter?” – both by Enterprise Knowledge, highlighting different aspects of knowledge graph first principles. And Veronika Heimsbakk explains knowledge graphs for dummies – and beyond.
Graph RAG galore
Despite hurdles in GenAI adoption, or precisely because of it, making the most of GenAI-powered systems by combining them with trustworthy information in controlled environments, aka RAG (Retrieval Augmented Generation) has been consistently receiving attention. The Graph RAG variant, which we covered extensively in the previous YotG issue, is evolving and seeing its own variants.
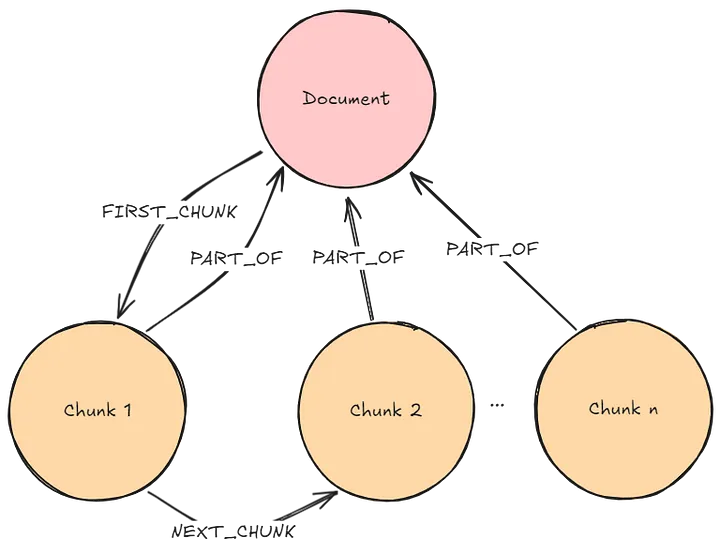
For an introduction to Graph RAG, check out “Democratizing data with Graph RAG: What it is, What it can do, How to evaluate it“. Τhis led to the Connected Data Knowledge Graph challenge, and an open source implementation based on Kuzu and visualized on G.V(). A conceptual introduction to Graph RAG is also given by Jakob Pörschmann, who then details an implementation on the Google Cloud stack.
In the last few months, we have seen Microsoft open-sourcing its Graph RAG implementation, providing improvements such as auto-tuning for rapid adaptation to new domains and dynamic community selection, and releasing LazyGraphRAG. LazyGraphRAG is meant to address a key criticism of Graph RAG, namely that it’s costly to implement. But there are more issues with Graph RAG.
This is why people like Irina Adamchic come up with alternatives to address those. Adamchic introduced a three-layer fixed entity architecture for efficient RAG on graphs. It relies on leveraging domain knowledge in a so-called ontology layer. She also developed a NLP-based variant that doesn’t rely on domain knowledge, while Elena Kohlwey navigates the world of advanced RAG patterns.
OG-RAG, by contrast, is a RAG variant offering ontology-grounded retrieval-augmented generation for Large Language Models. KET-RAG promises 10x cheaper, smarter knowledge retrieval. MiniRAG introduces near-LLM accurate RAG for Small Language Models with just 25% of the storage. Mindful-RAG is a framework designed for intent-based and contextually aligned knowledge retrieval.
GFM-RAG is a graph foundation model for RAG. GNN-RAG uses a Graph Neural Retrieval for LLM reasoning. NodeRAG is a Graph RAG variant which uses heterogeneous graphs with fine-grained semantic units, entities, relationships, and high-level summaries instead of homogeneous graphs. SimGRAG transforms queries into graph patterns and aligns them with candidate subgraphs using a graph semantic distance metric.
mmGraphRAG taps into non-textual data like images and audio. PathRAG effectively reduces redundant information with flow-based pruning, while guiding LLMs to generate more logical and coherent responses with path-based prompting. CDF-RAG iteratively refines queries, retrieves structured causal graphs, and enables multi-hop causal reasoning across interconnected knowledge sources.
A survey on Graph RAG formalizes the GraphRAG workflow, outlines the core technologies and training methods at each stage, examines downstream tasks, application domains, evaluation methodologies, and industrial use cases and explores future research directions.
Paco Nathan unbundles the Graph in GraphRAG, Lettria, Jay Yu and May Habib benchmark it, and Francois Vanderseypen shares a conceptual overview for building robust solutions and a collection of graph RAG open source stacks to generate and visualize knowledge graphs.
Eventually, it may be Hybrid RAG approaches that may prove flexible enough to adjust to different scenarios. For many applications, a combination of retrieval methods, orchestrated by a smart router, may provide the best balance of performance and flexibility.
New graph database engines, standardization and performance
Although Graph RAG has been a boon for graph database vendors, it’s also possible to implement Graph RAG without a graph database. Aggregating graph databases and knowledge graphs in one category as the Research and Markets report did may not be something everyone will agree with. But it’s understandable why graph databases are marked as the largest part of this aggregated category.
Graph databases have been around for a long time by now. Like all SQL antagonists, their utility is sometimes questioned, and they have ups and downs in terms of mindshare. But overall they are on a growth trajectory, with use cases being increasingly understood, standardization and educational resources facilitating adoption, and important new developments in the market.
In “Graph Databases after 15 Years – Where Are They Headed?“, Gábor Szárnyas summarizes the history of graph database systems, focusing on their main categories and use cases. He then discusses the key challenges that continue to hinder the adoption of graph databases, including a fragmented landscape and performance limitations.
He wraps up with recent positive developments: (1) Advances in standardization that led to the ISO GQL and SQL/PGQ languages, (2) Performance improvements, (3) A new generation of open-source graph database systems. Bonus tracks – Semih Salihoğlu’s introduction and background on graph databases, and Joe Dreyer’s guide to graph databases.
We have covered the developments in standardization in previous newsletters. Keith Hare shares current status, and Alastair Green highlights new GQL features, and the ongoing effort to close the “ontology gap” and align RDF vocabularies and LPG schemas. Alex Milowski also elaborates on GQL Schemas and Types.
Graph database vendors keep evolving as well. Google entered the graph database market with Spanner Graph, AWS took one more step towards the One Graph vision for Neptune, and Neo4j released new self-service and GenAI features. Spanner Graph is now GA, Neo4j has introduced Aura Graph Analytics, and Amazon Neptune powers Amazon Bedrock Knowledge Bases with Graph RAG.
At the same time, we also notice the evolution in graph database performance, with new vendors and engines such as Neo4j BIFROST, Stardog BARQ, Aerospike Graph, Data Graphs, QLever, Kuzu, and HugeGraph.
What if fitness wasn’t about following a strict routine—but about building a plan that works for YOU?
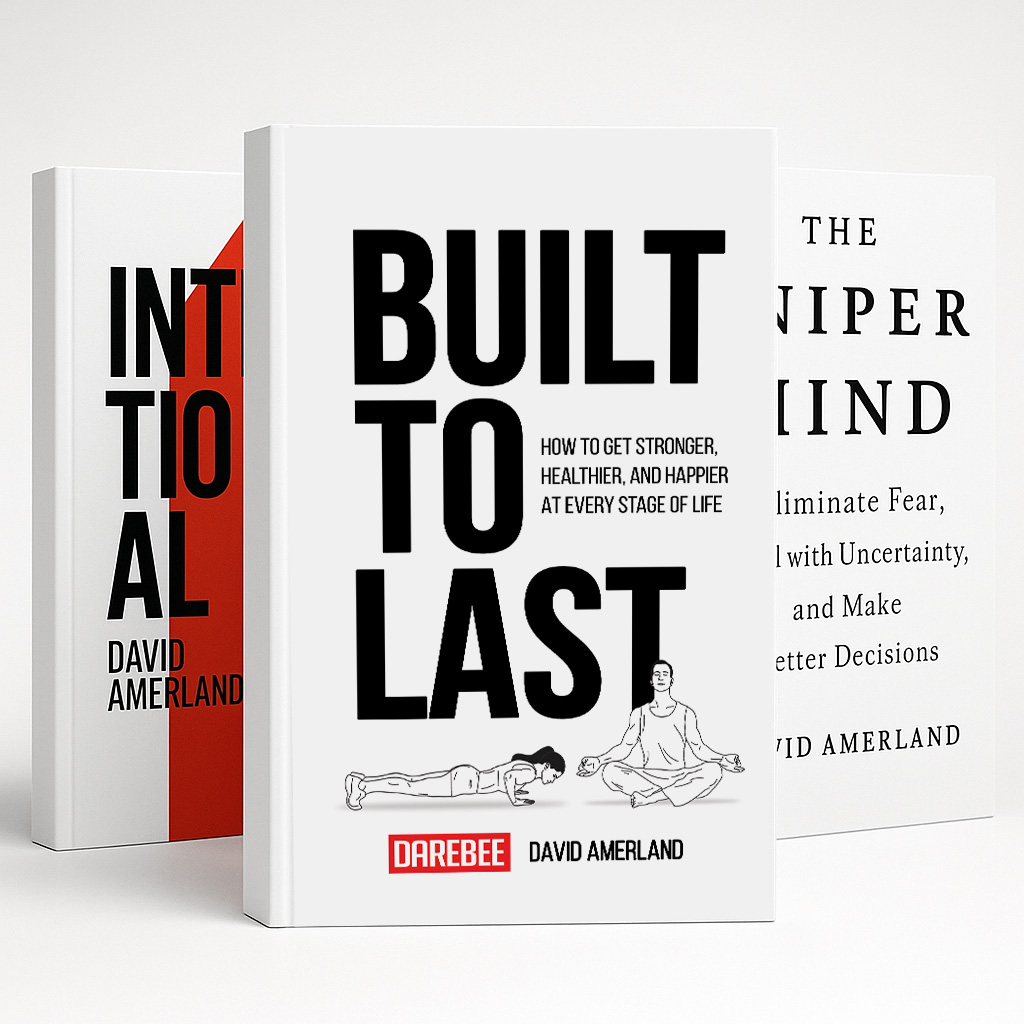
“Built To Last” isn’t just another fitness book. It’s a practical, customizable guide designed to help you create a sustainable approach to health, movement, and longevity. Whether you’re just starting your journey or fine-tuning your current routine, this book gives you the tools to take control of your fitness—on your terms.
🎯 Why Built To Last is Different
Unlike other fitness books that push quick fixes and extreme regimens, Built To Last is based on real science, real results, and real sustainability.
Graph analytics and visualization: roadmap, features and platforms
How might forthcoming graph processing systems deliver extensive scalability, efficiency, and versatile querying and analytical functionalities to meet the diverse demands of real-world scenarios? This is the overarching question that a panel of experts set out to address in a ACM Sigmod panel. They published their findings in “A Roadmap to Graph Analytics“.
Visual analytics is a natural complement for graph analytics. The i2 Group published a list of considerations for knowledge graph visualization and analytics, highlighting Flexibility, Ontology Alignment , Visualization, Dynamic Styling, Aggregation, Grouping and Summarization, Customization, Semantics, De-duplication and Entity Resolution, Data Lineage and support for Special types.
New tools and capabilities for graph visualization were unveiled recently. G.V() is a graph database client & visualization tool that started out with Gremlin and now also supports Neo4j, Memgraph, and Neptune Analytics. RDF-to-Gephi is an open source tool to visualize RDF knowledge graphs. And a new yFiles open source widget makes it convenient to add graph visualizations of SPARQL queries to Jupyter Notebooks.
Graph Foundation Models, applications at scale, LLMs and graphs
We also have new developments In the area of Graph AI, some of them sparked by the LLM wave, some continuing the existing wave of innovation. Michael Galkin argues that the era of Graph Foundation Models has begun, and provides a few examples of how one can use them already today. Case in point: AnyGraph, a Graph Foundation Model in the wild.
Galkin also warns that Graph Learning may lose relevance due to poor benchmarks, while a group of researchers from Huawei and research institutes explore the foundations and frontiers of Graph Learning theory. If you want to get up to speed with GNNs, this introduction to Graph Neural Networks and this list of must-read papers on GNNs will be handy.
Researchers from Amazon introduce GraphStorm, an all-in-one open source graph machine learning framework for industry applications that has been used and deployed for over a dozen billion-scale industry applications. Snapchat also uses large-scale graph neural networks in production, leveraging their own open source framework called GiGL (Gigantic Graph Learning).
Google’s Bryan Perozzi shares how graphs can help represent structured data for LLMs, covering graph encoding, GraphTokens, Transformer graph reasoning, and using graphs for synthetic data generation. Also of note on the latter topic, RDFGraphGen and LinkGen.
In “Plan Like a Graph”, researchers improve LLM task execution by decomposing them into sub-tasks that can be either solved by the LLM in parallel or sequentially. All these sub-tasks form an execution graph. GraCoRe is a benchmark for graph comprehension and complex reasoning in LLMs.
Bryan Perozzi also shared his team’s work on Graph reasoning with LLMs. And “A Survey of Large Language Models for Graphs” introduces a novel taxonomy for categorizing existing methods that combine LLMs and GNNs.
A different way to mix graphs and Language models: Graph Language Models are graph transformers, which enables graph reasoning. Simultaneously, they inherit and exploit Language Model weights, enabling them to represent and contextualize triplets in a Graph of Triplets. Relational Graph Transformers is a new architecture transforming how we extract intelligence from relational databases.
Wrapping up with a thought – provoking question, and a new way to look at LLMs: What if your LLM is a graph? As Pierre-Carl Langlais comments on the analysis shared by Petar Veličković, once you start seeing LLMs as graph neural networks, many structural oddities suddenly fall into place. In what is arguably the flip side, Kurt Cagle lays out the differences between LLMs and knowledge graphs.
This issue of the Year of the Graph is brought to you by G.V(), metaphacts, Connected Data London, and Built to Last.
If you want to be featured in an upcoming issue and support this work, reach out!
Related posts:
 Knowledge Graph Enlightenment, AI and RAG. The Year of the Graph Newsletter Vol. 26, Summer 2024
 Graphs, analytics, and Generative AI. The Year of the Graph Newsletter Vol. 25, Winter 2023 – 2024
 Return of the Graph: Geospatial Knowledge Graphs, Personal Knowledge Graphs, and Evolution. The Year of the Graph Newsletter Vol. 24, Spring 2023
 Graph Therapy. The Year of the Graph Newsletter Vol. 20, June / May 2020


4 comments to “The evolution of the graph technology and business landscape in 2025. The Year of the Graph Newsletter Vol. 27, Spring – Summer 2025”
[…] knowledge graph market is estimated at USD 1.06 billion in 2024 to USD 6.93 billion by 2030, at a Compound Annual Growth Rate (CAGR) of […]
This article provides a comprehensive overview of knowledge graphs, their growing importance in AI, and the challenges organizations face. The insights into real-world applications and future trends are particularly valuable for anyone interested in leveraging graph technology.
[…] and methodologies around graphs. This issue of the Year of the Graph reflects this. Even though it’s only been 3 months since the previous one, and the targeted curation approach hasn’t changed, it’s the longest issue to […]
[…] another signal pointing in the direction of growth for the graph market: Linkurious, who just published the 2026 update of their Graph technology landscape, are getting […]