About
The Year of the Graph is a central node for all things Graph.
Here you can get started with and keep track of all things Graph Year over Year.
Editorial and a collection of news from industry and research
The definitive report on Graph Databases
All things graph, organized under 4 key categories:

Here’s a bit of background, and how to navigate and make the most of The Year of the Graph.
Graph: a key technology for the 2020s and beyond
Up until the beginning of the 2010s, the world was mostly running on spreadsheets and relational databases. To a large extent, it still does. But the NoSQL wave of databases has largely succeeded in instilling the “best tool for the job” mindset.
After relational, key-value, document, and columnar, the latest link in this evolutionary proliferation of data structures is graph.
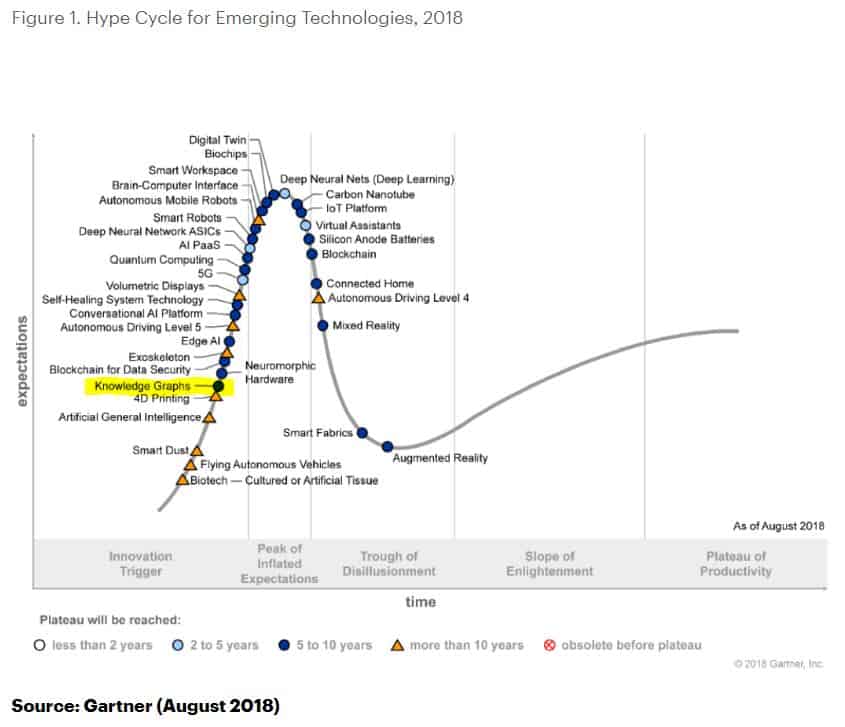
Graph analytics, Graph AI, Knowledge Graphs and Graph Databases have been making waves, included in hype cycles since 2018. That’s the year that marks the beginning of The Years of the Graph.
The Beginning of the Years of the Graph
The Year of the Graph marked the beginning of it all before the Gartners of the world got in the game. The Year of the Graph is a term coined to convey the fact that the time has come for this technology to flourish. The eponymous article that set the tone was published in January 2018 on ZDNet by domain expert George Anadiotis.
George has been working with, and keeping an eye on, all things Graph since the early 2000s. He was one of the first to note the continuing rise of Graph Databases, and to bring this technology in front of a mainstream audience.
Keeping track of all things Graph Year over Year
The Year of the Graph has been going strong since 2018. In August 2018, Gartner started including Graph in its hype cycles. Ever since, Graph has been riding the hype cycle waves.
The need for knowledge on these technologies is constantly growing. To respond to that need, the Year of the Graph newsletter was released in April 2018. In addition, a constant flow of graph-related news and resources is being shared on social media.
To help people make educated choices, the Year of the Graph Database Report was released. The report has been hailed as the most comprehensive of its kind in the market, consistently helping people choose the most appropriate solution for their use case since 2018.
The report, articles, news stream, and the newsletter have been reaching thousands of people, helping them understand and navigate this landscape. The Year of the Graph is their home: a central node for all things Graph.